A cartoon illustration of a pencil writing on a gray notepad.

MEDICAL & BIOLOGICAL VISUALIZATION

As a member of the Dawson Lab, you have access to Medical & Biological visualization services. These services include collaboration and creation of custom illustrations like Graphical Abstracts, Schematic Figures, Grant Project Diagrams, 2D & 3D animation, and Cover Art for publication as well as the use of generic stock illustrations for presentation use.

START A PROJECT

Request a custom illustration for publication use.

  • Step 1: Download the Custom Illustration Request Form and enter the project proposal information.

  • Step 2: E-mail your completed form to the Dawson Lab Medical Illustrator, Noelle Burgess, at nburges5@jh.edu.

  • Step 3: Once your project proposal has been reviewed, an introductory meeting will be scheduled to review project information and discuss the project timeline.

Download Custom Request Form

Request a stock illustration for presentation.

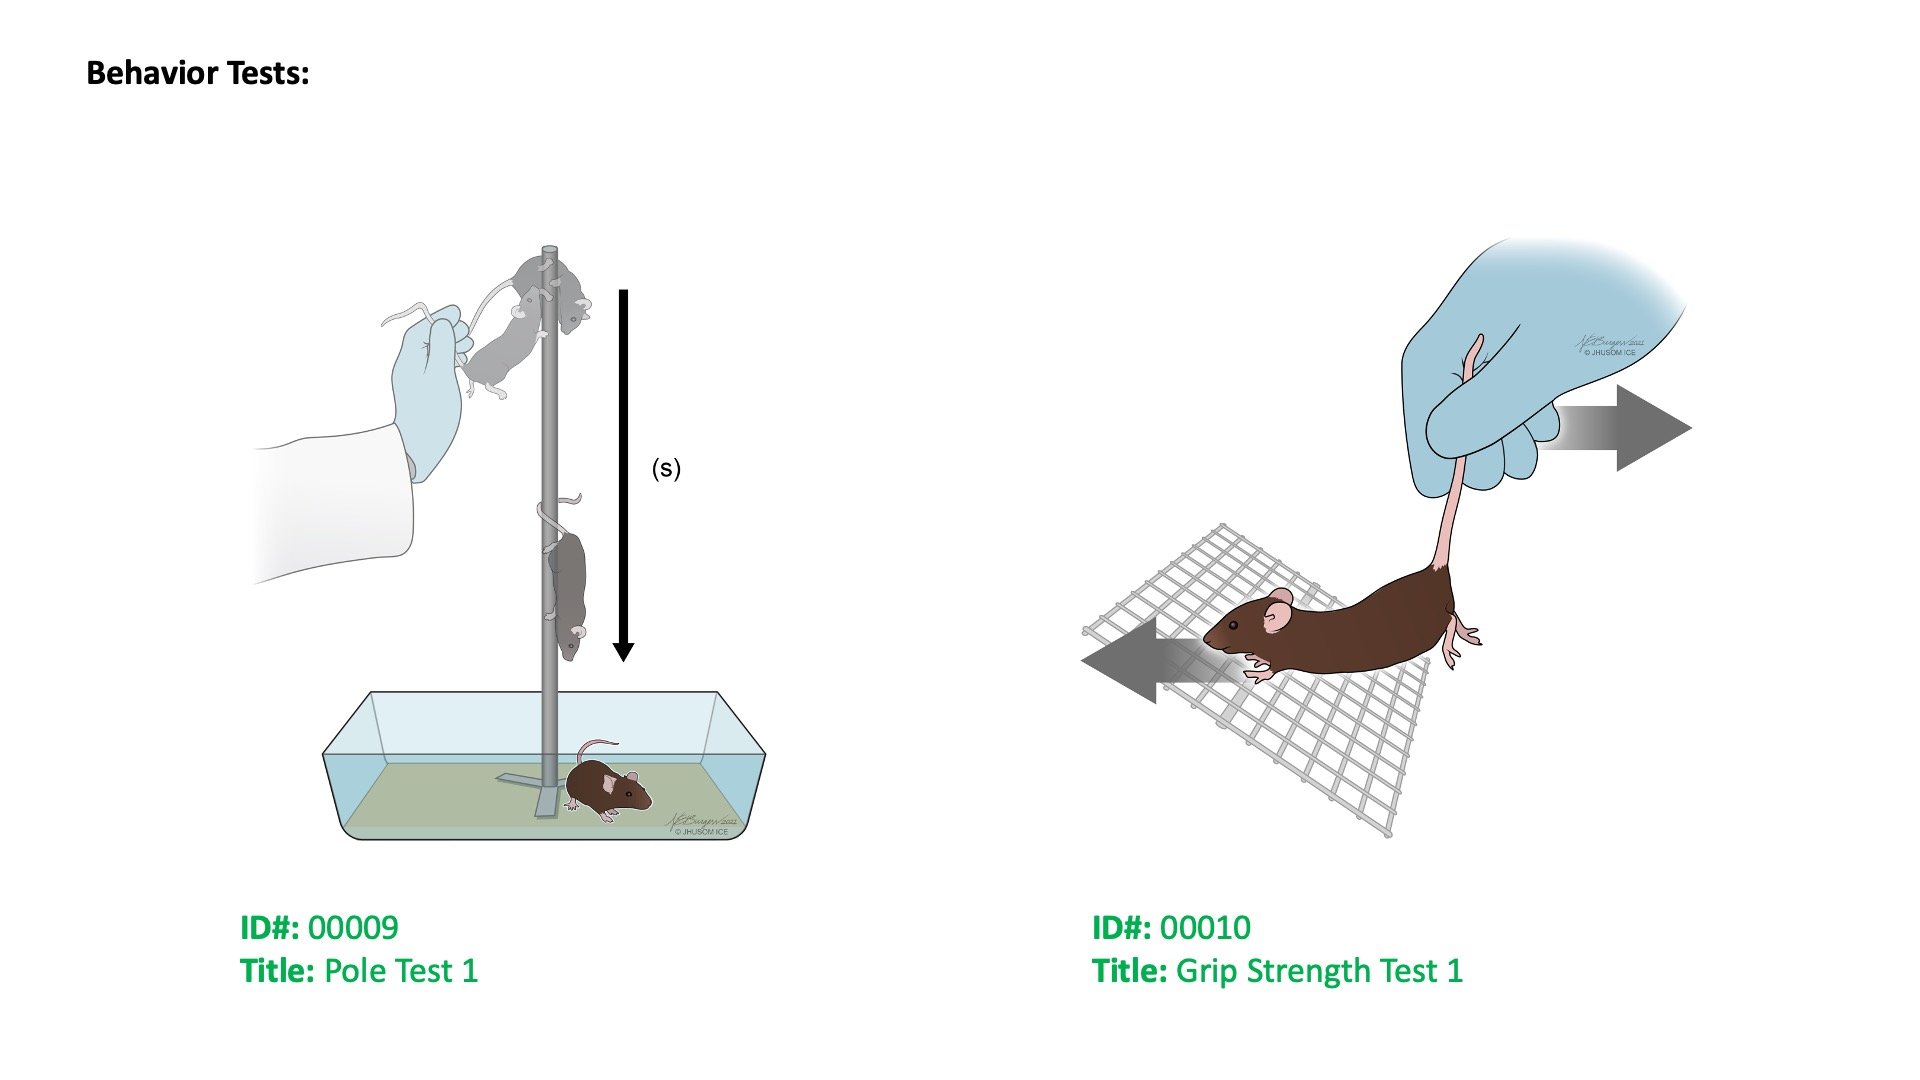
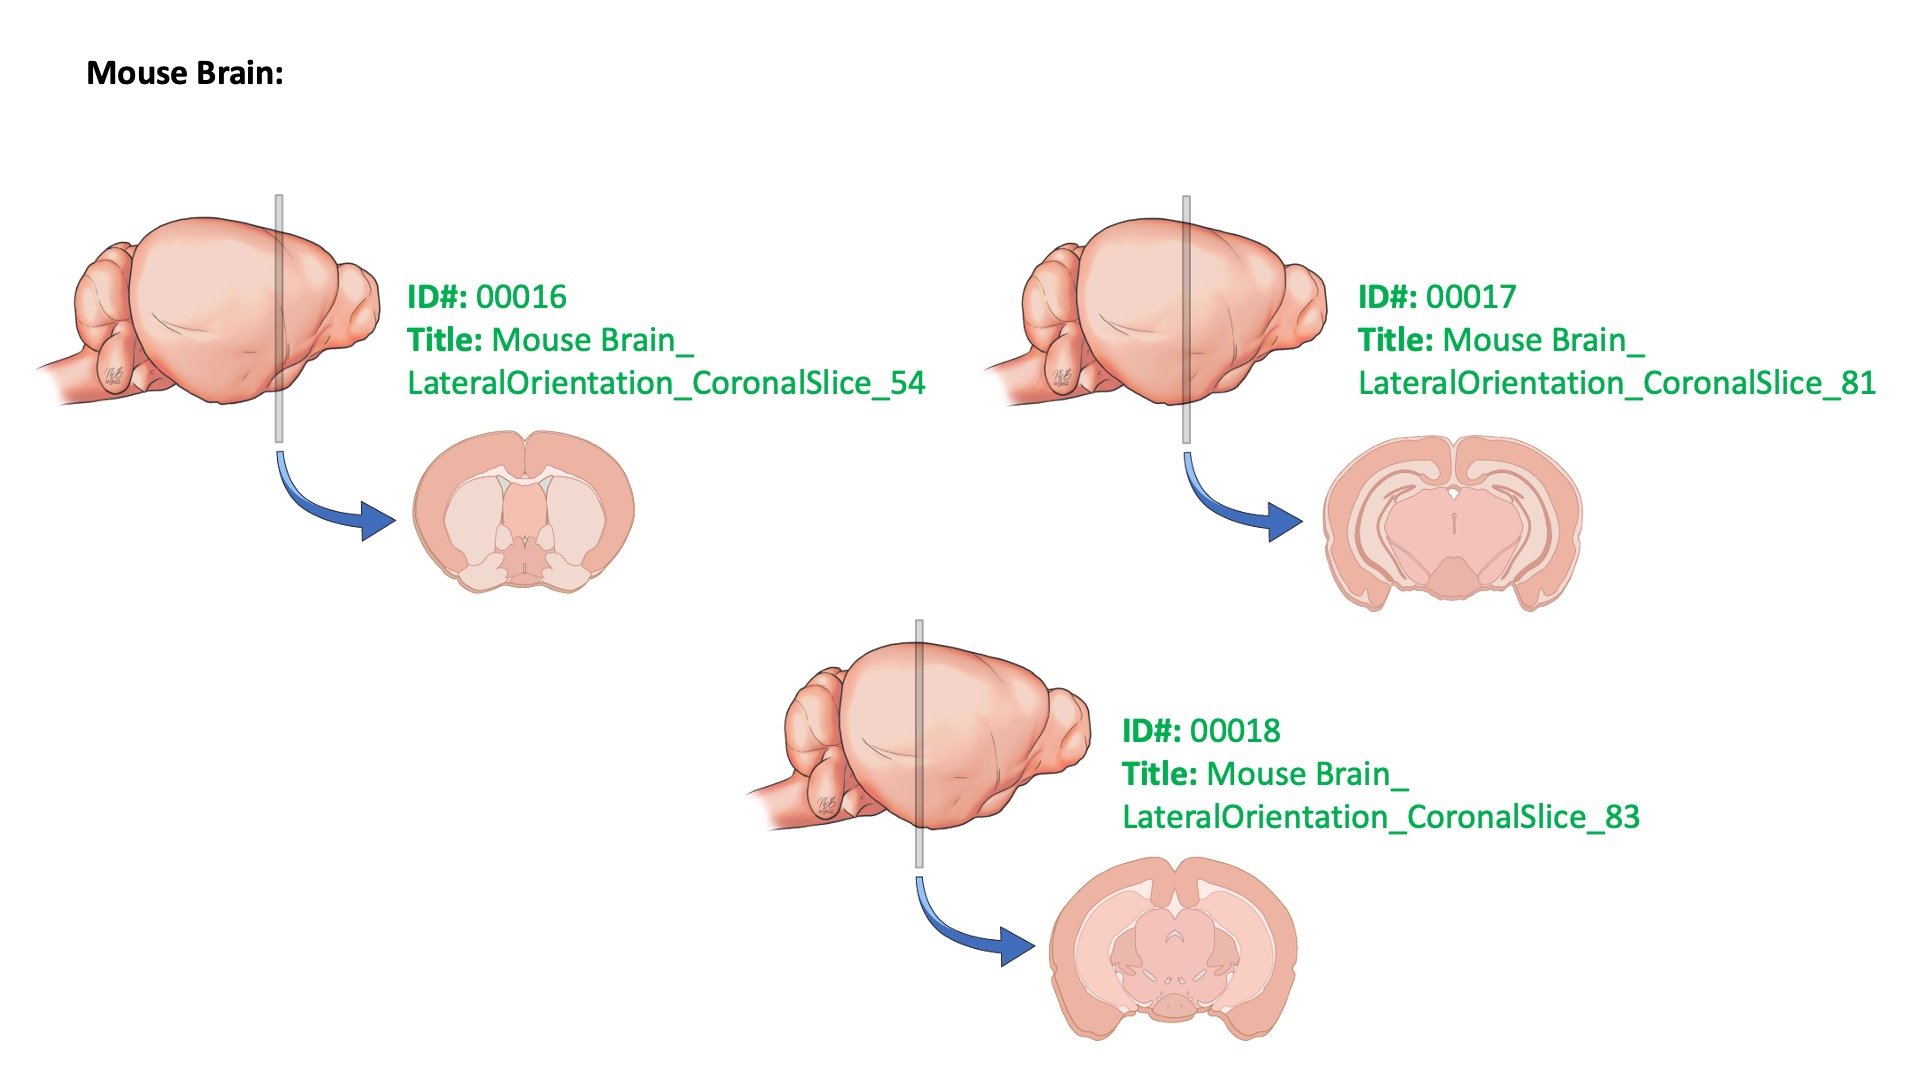
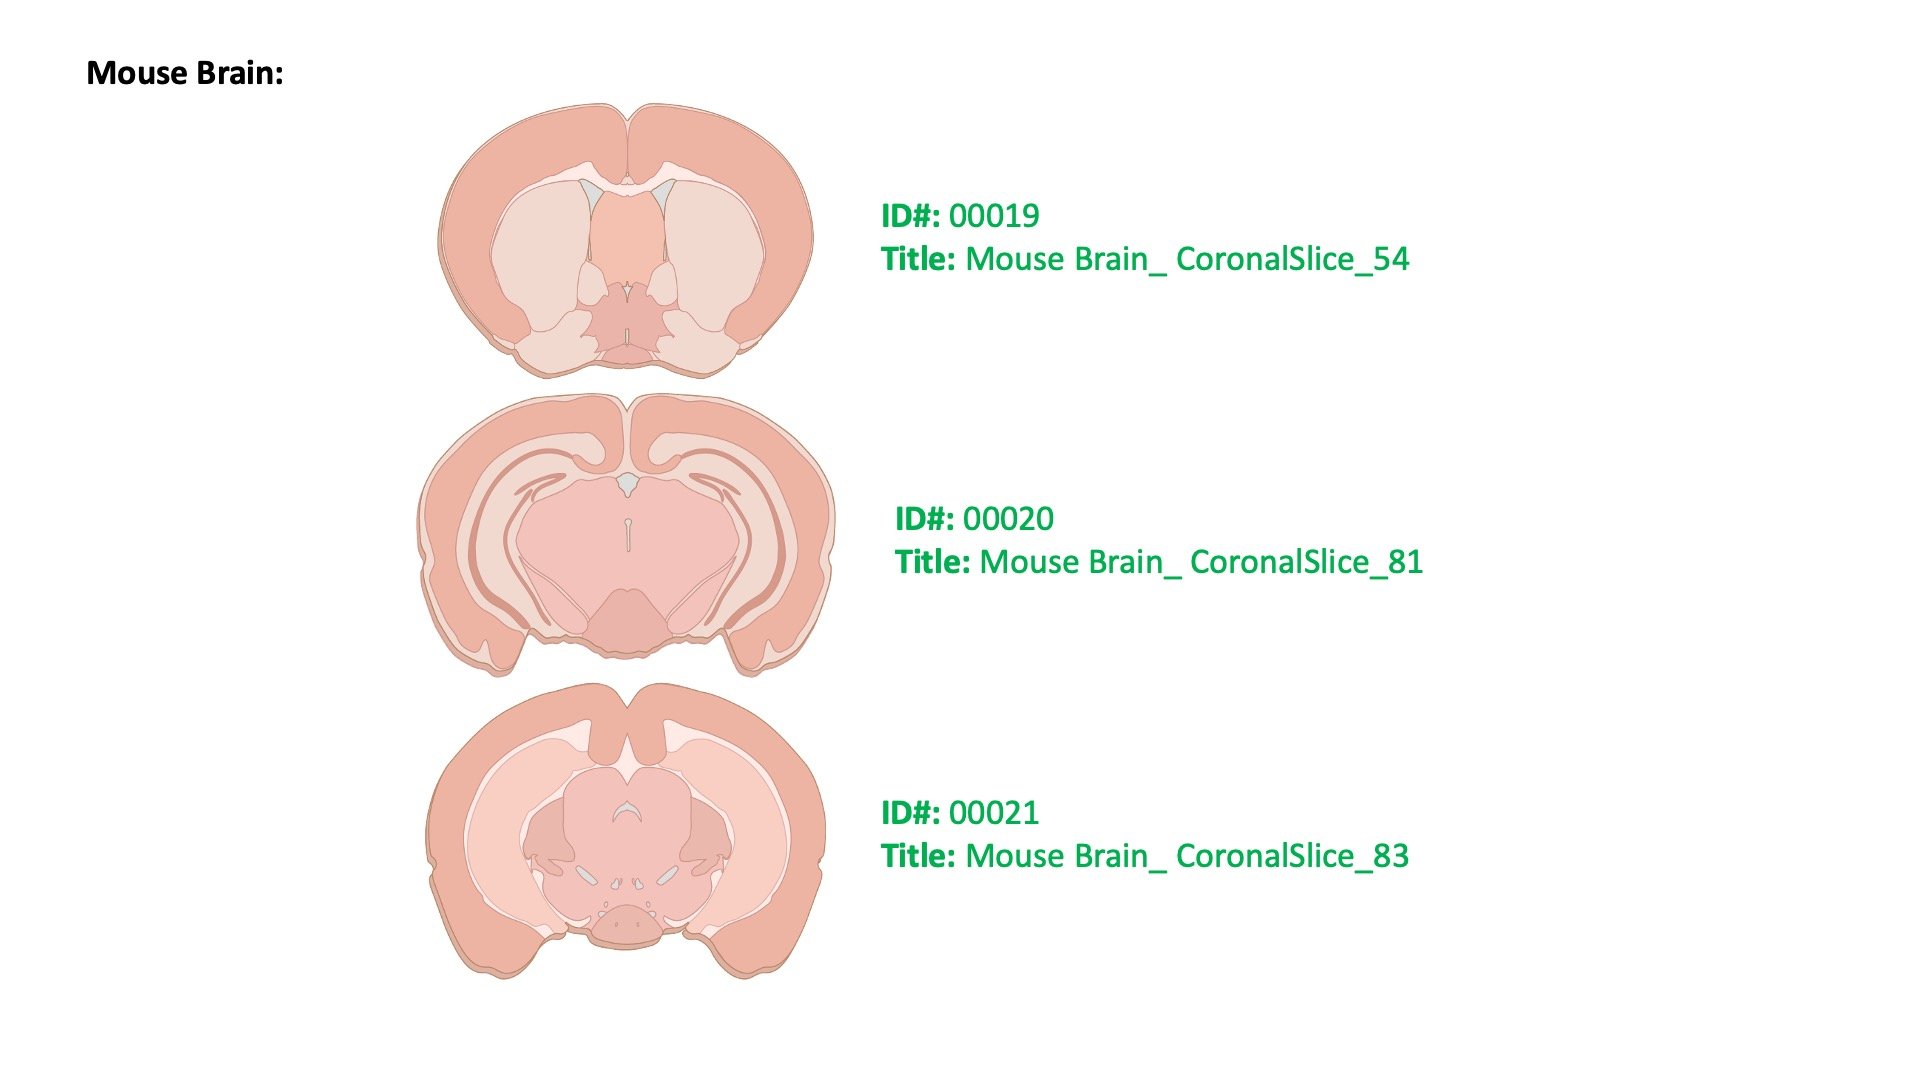
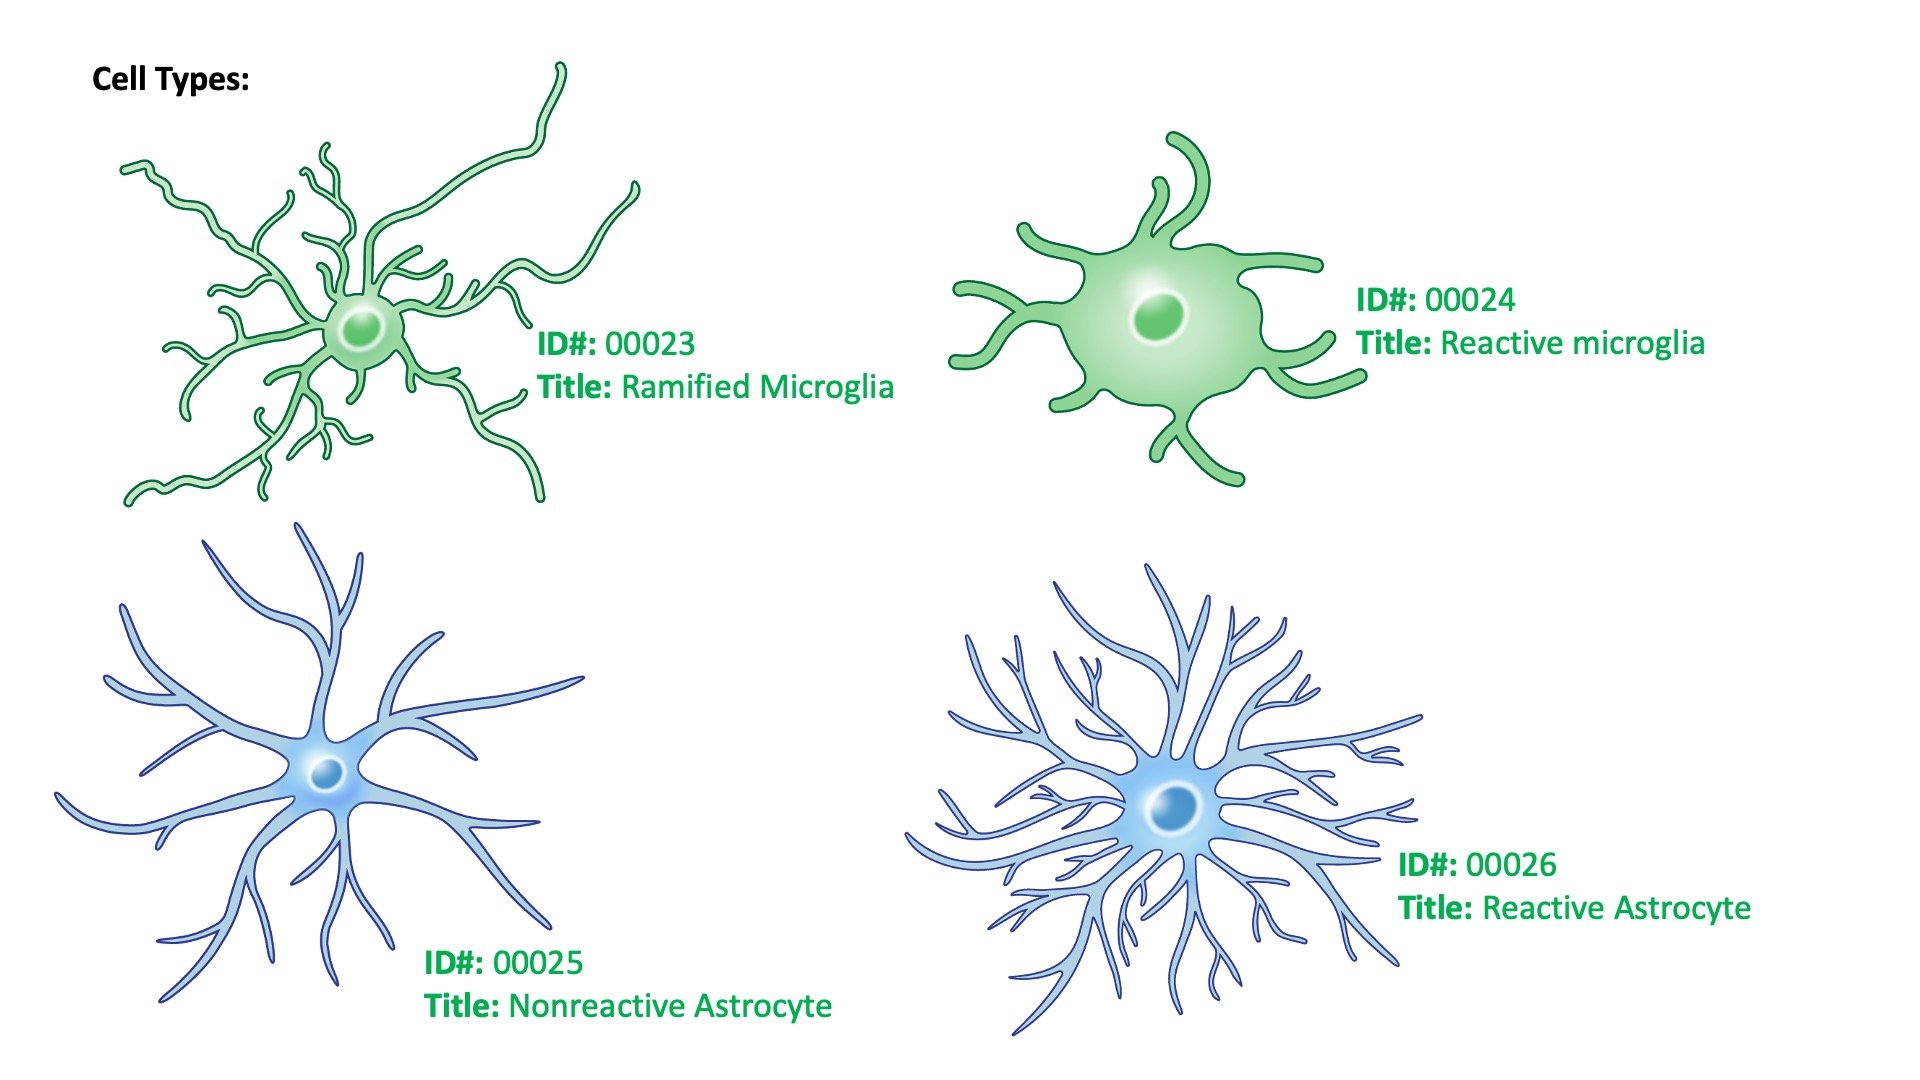
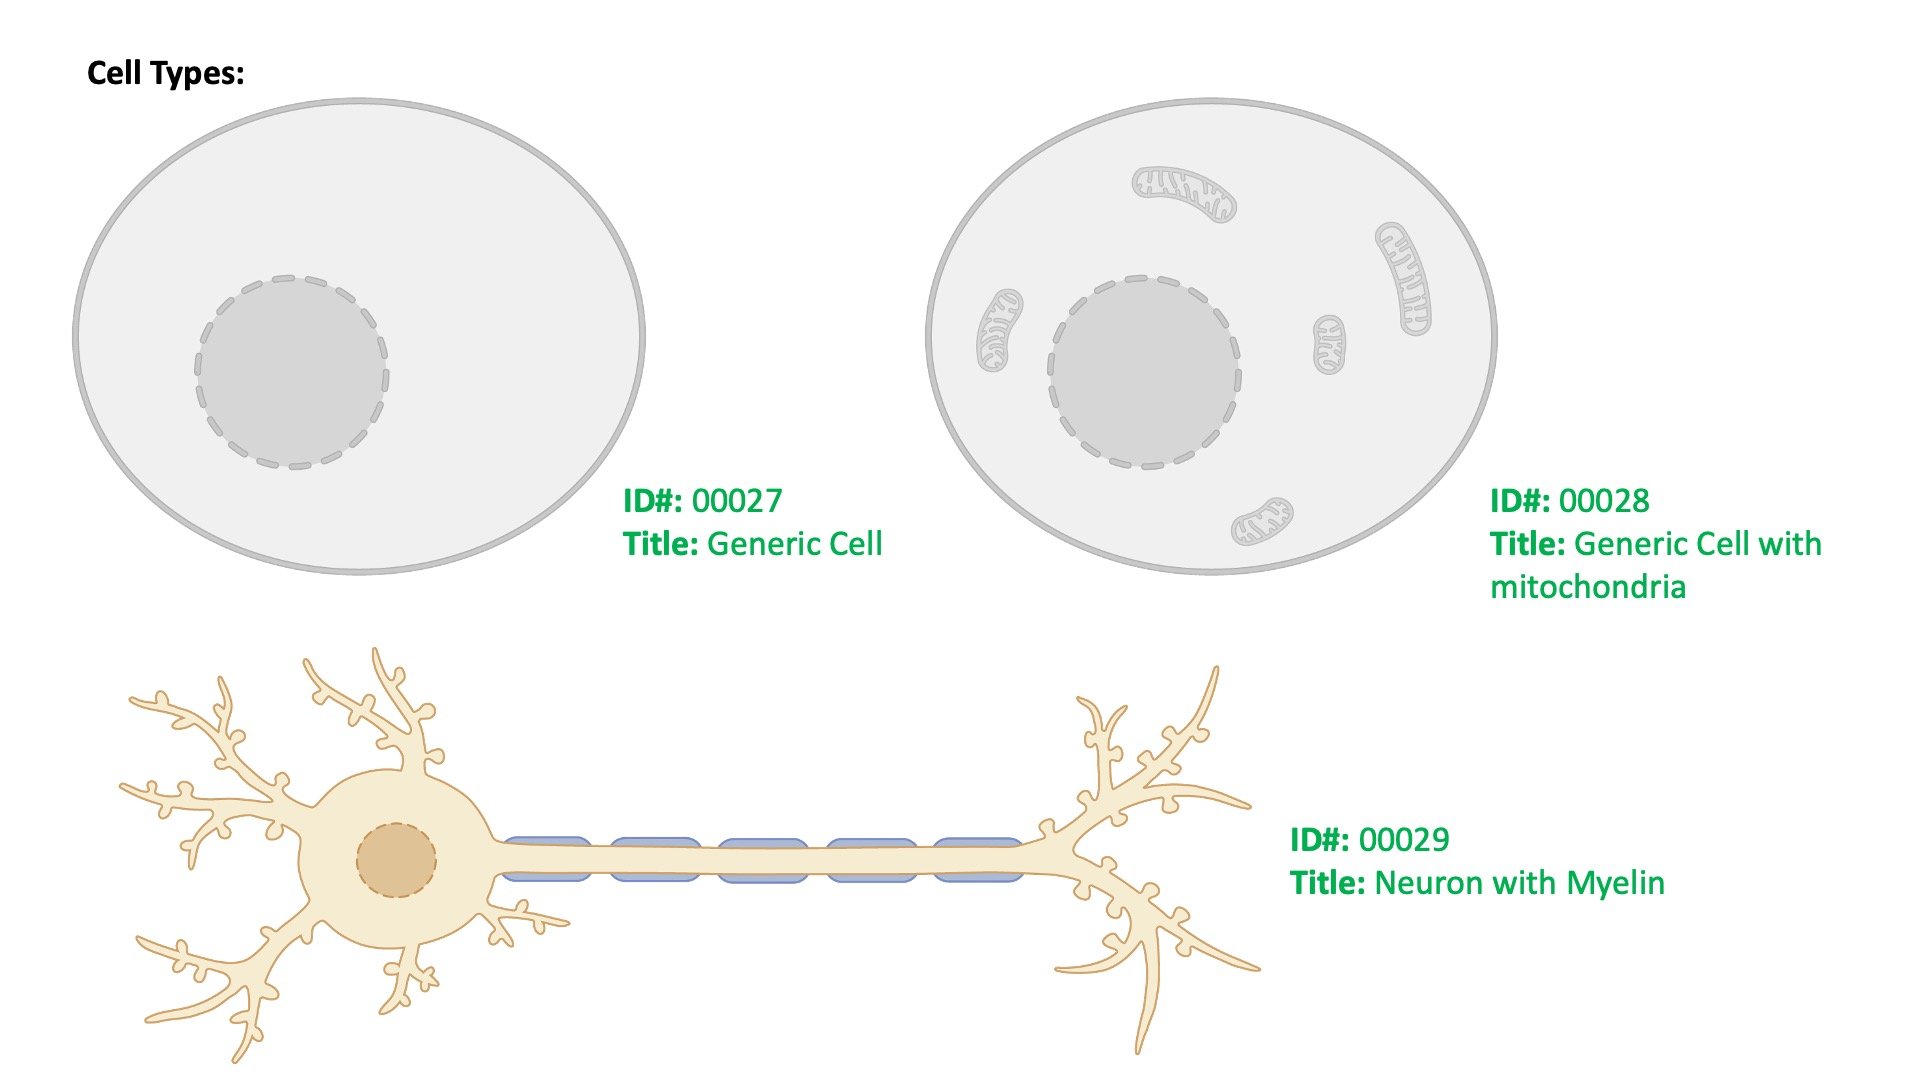
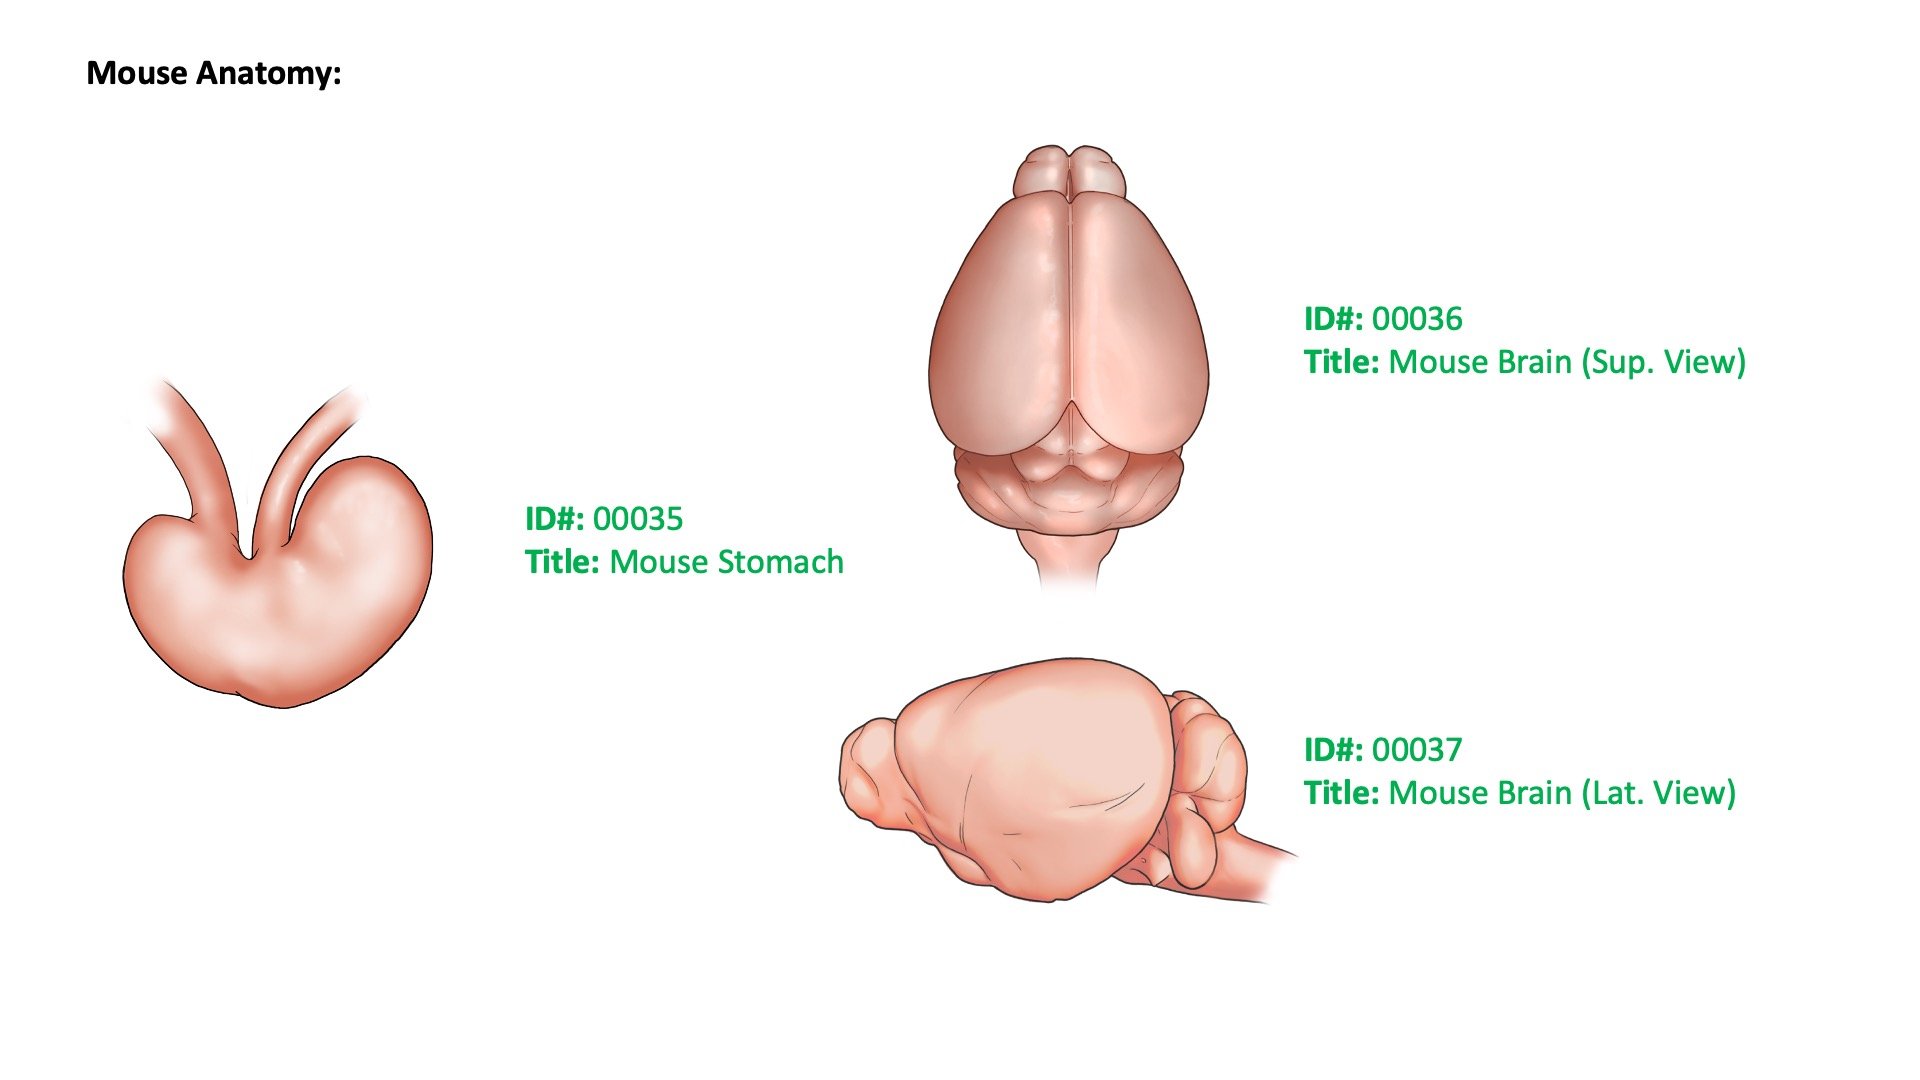
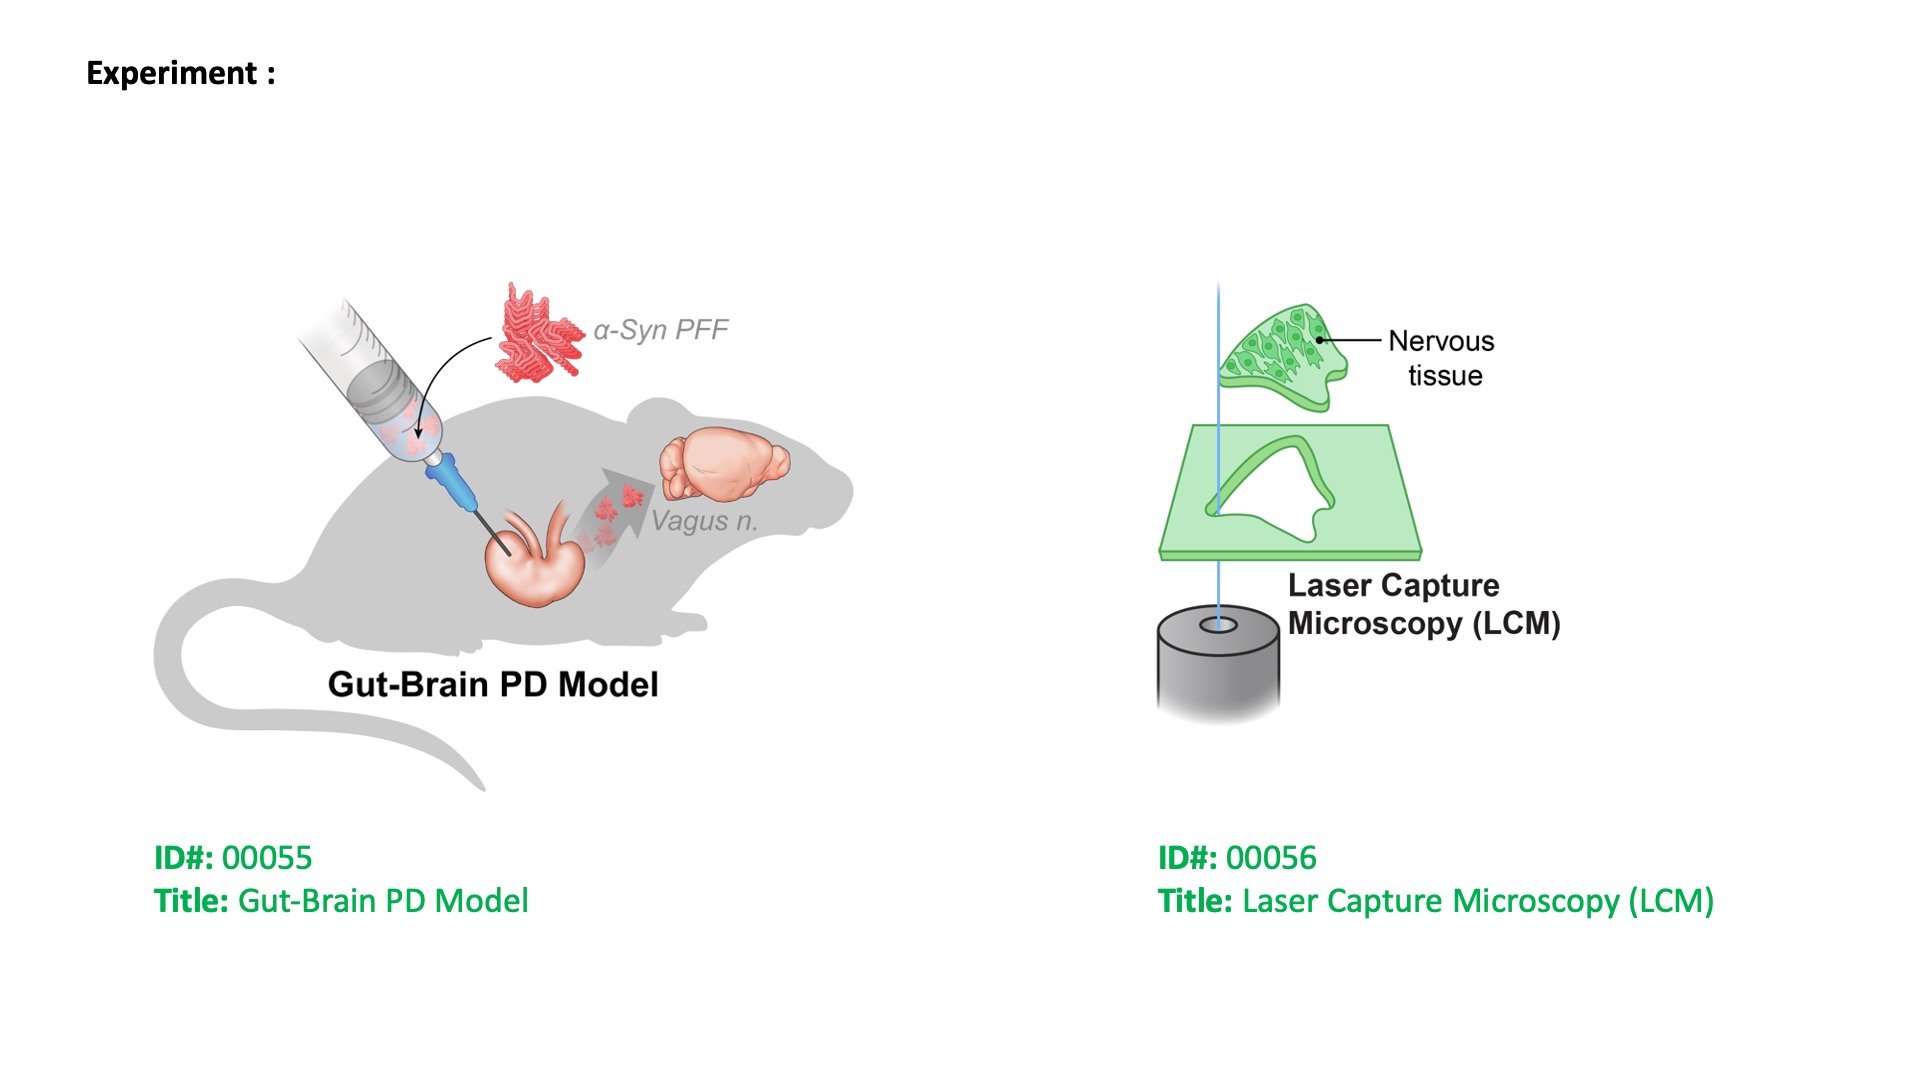
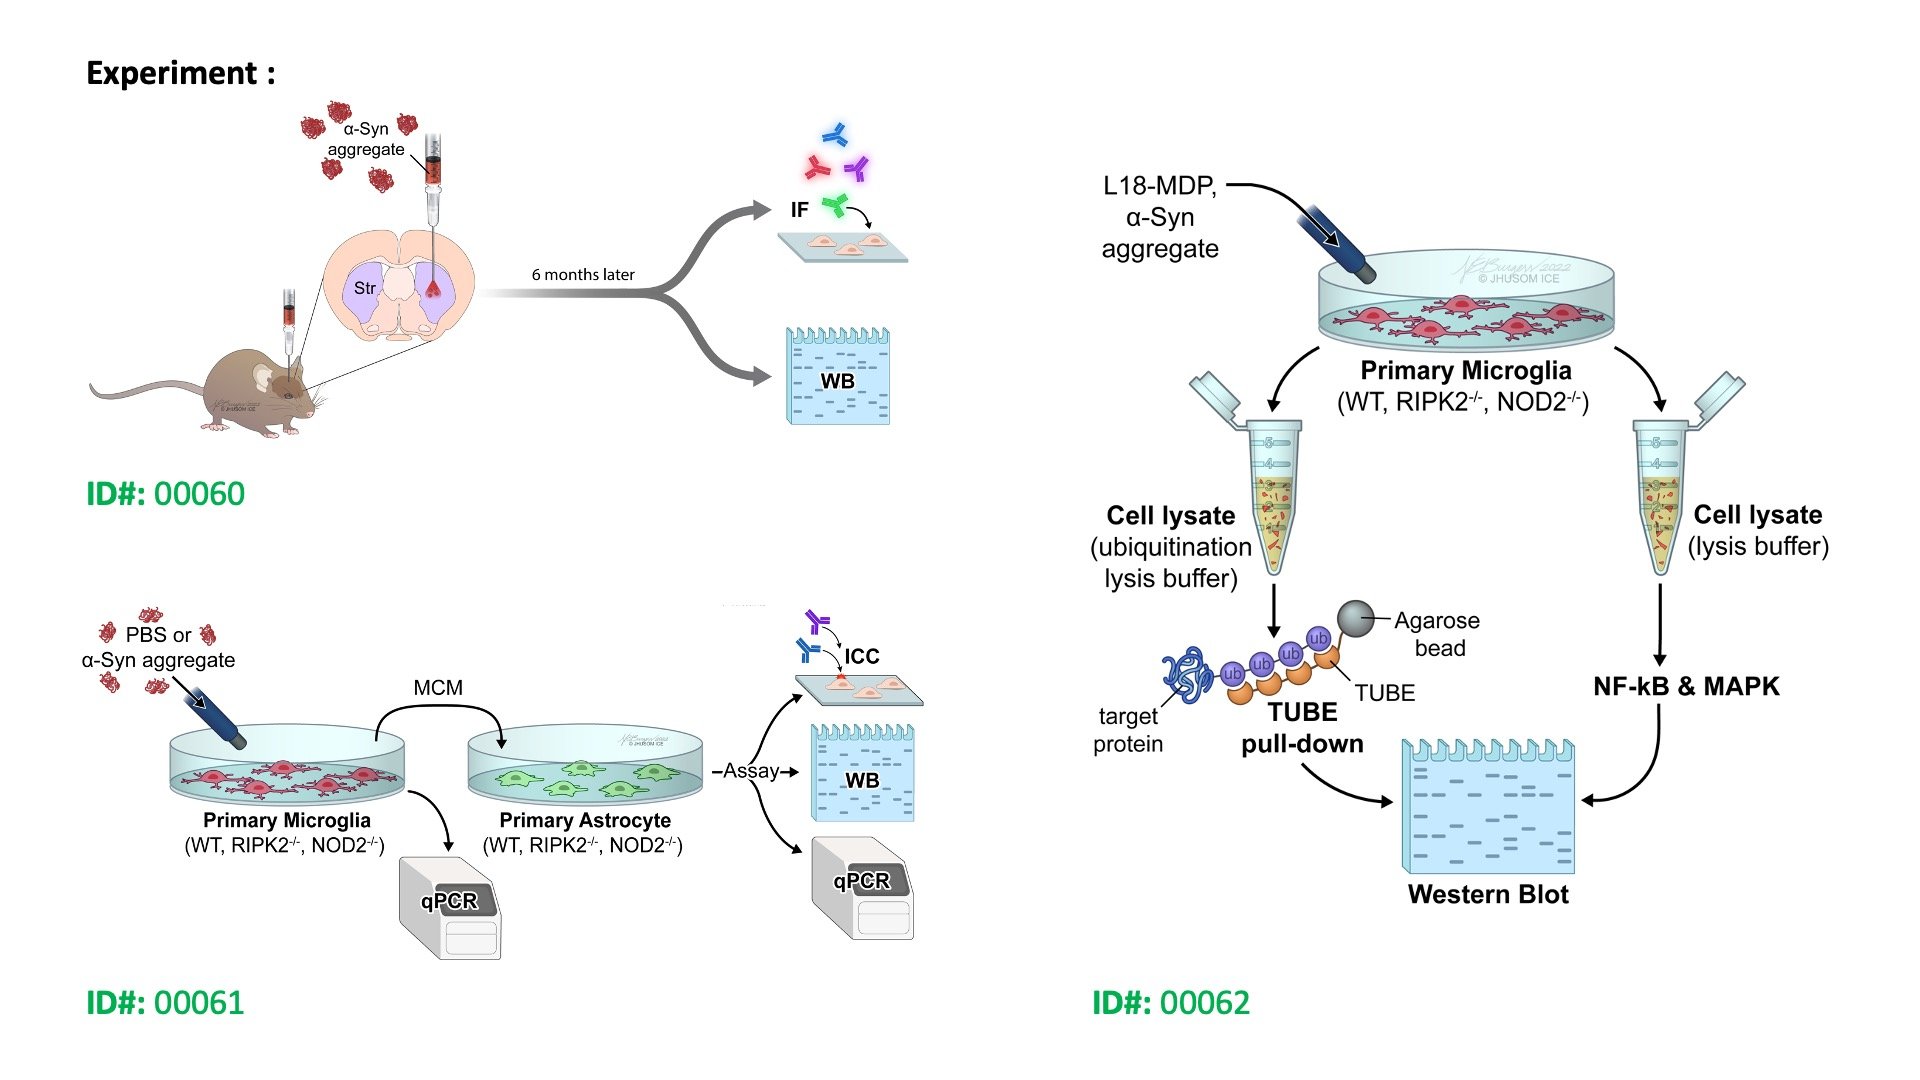
  • Step 1: Review the Stock Illustration Catalogue (below) - make a note of the ID# and Title of images you would like to use

  • Step 2: Download the Stock Illustration Request Form and enter the ID# and Title of the images you are requesting access to.

  • Step 3: E-mail your completed form to the Dawson Lab Medical Illustrator, Gilbert Chen, at hchen156@jh.edu.

  • Step 4: Access will be provided to requested stock image files (at 150 dpi) within 24 hours of form submission (excluding weekends).

  • Don’t see what you need? Submit a Stock Illustration Request describing the cell type, behavior test, or assay diagram you need to illustrate.

Download Stock Request Form

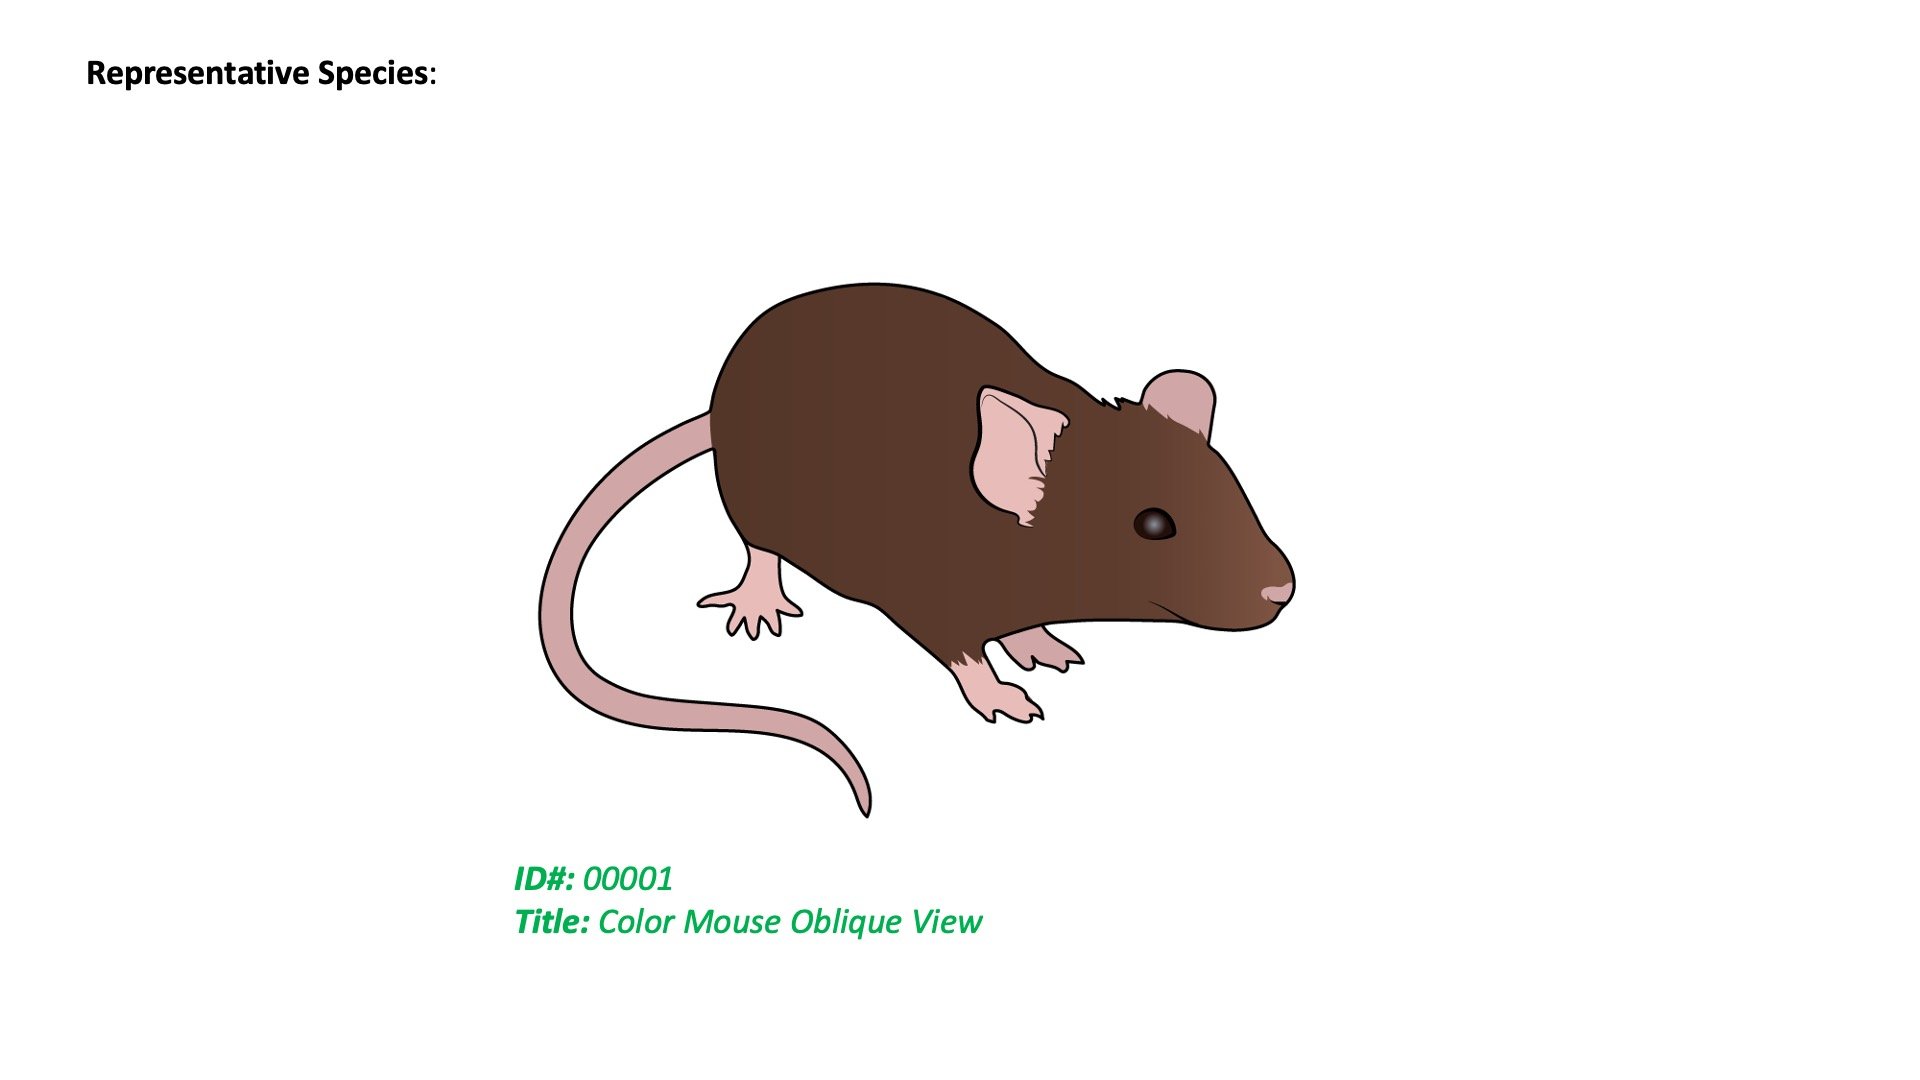
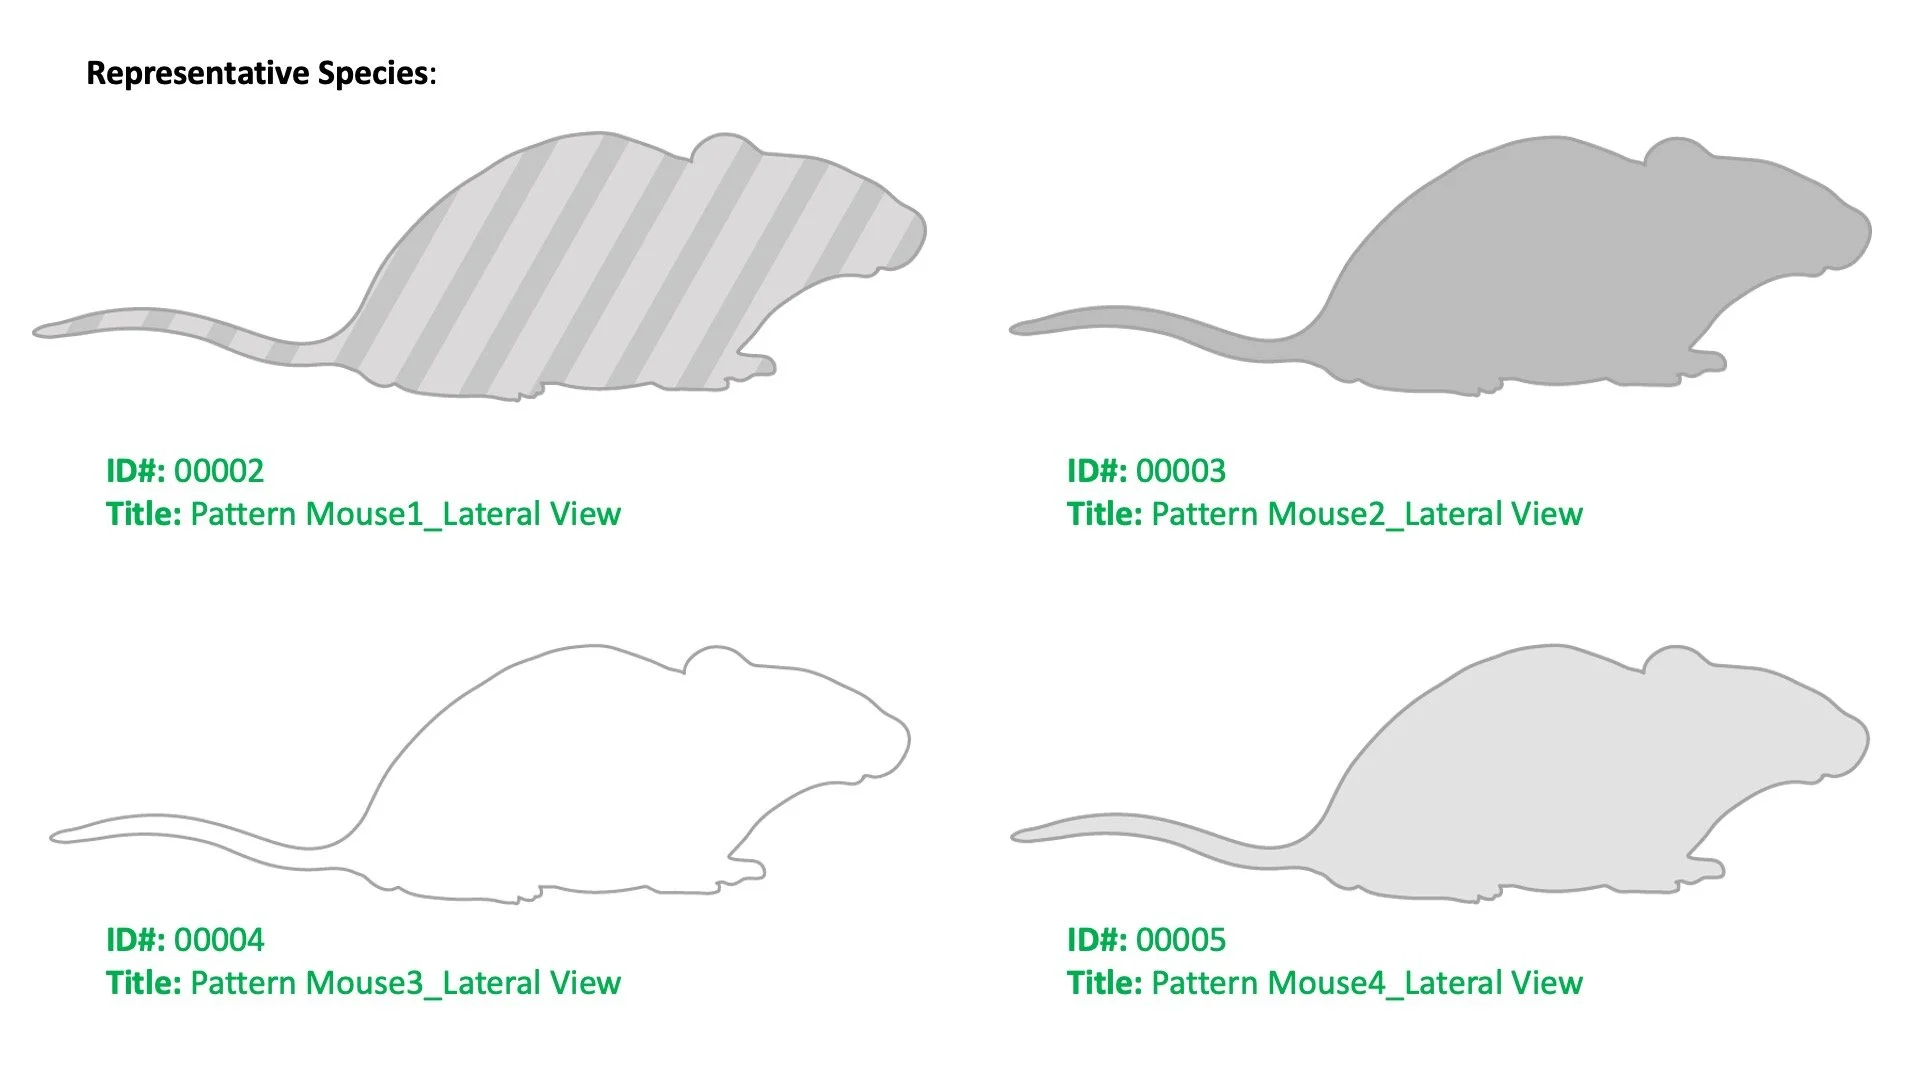
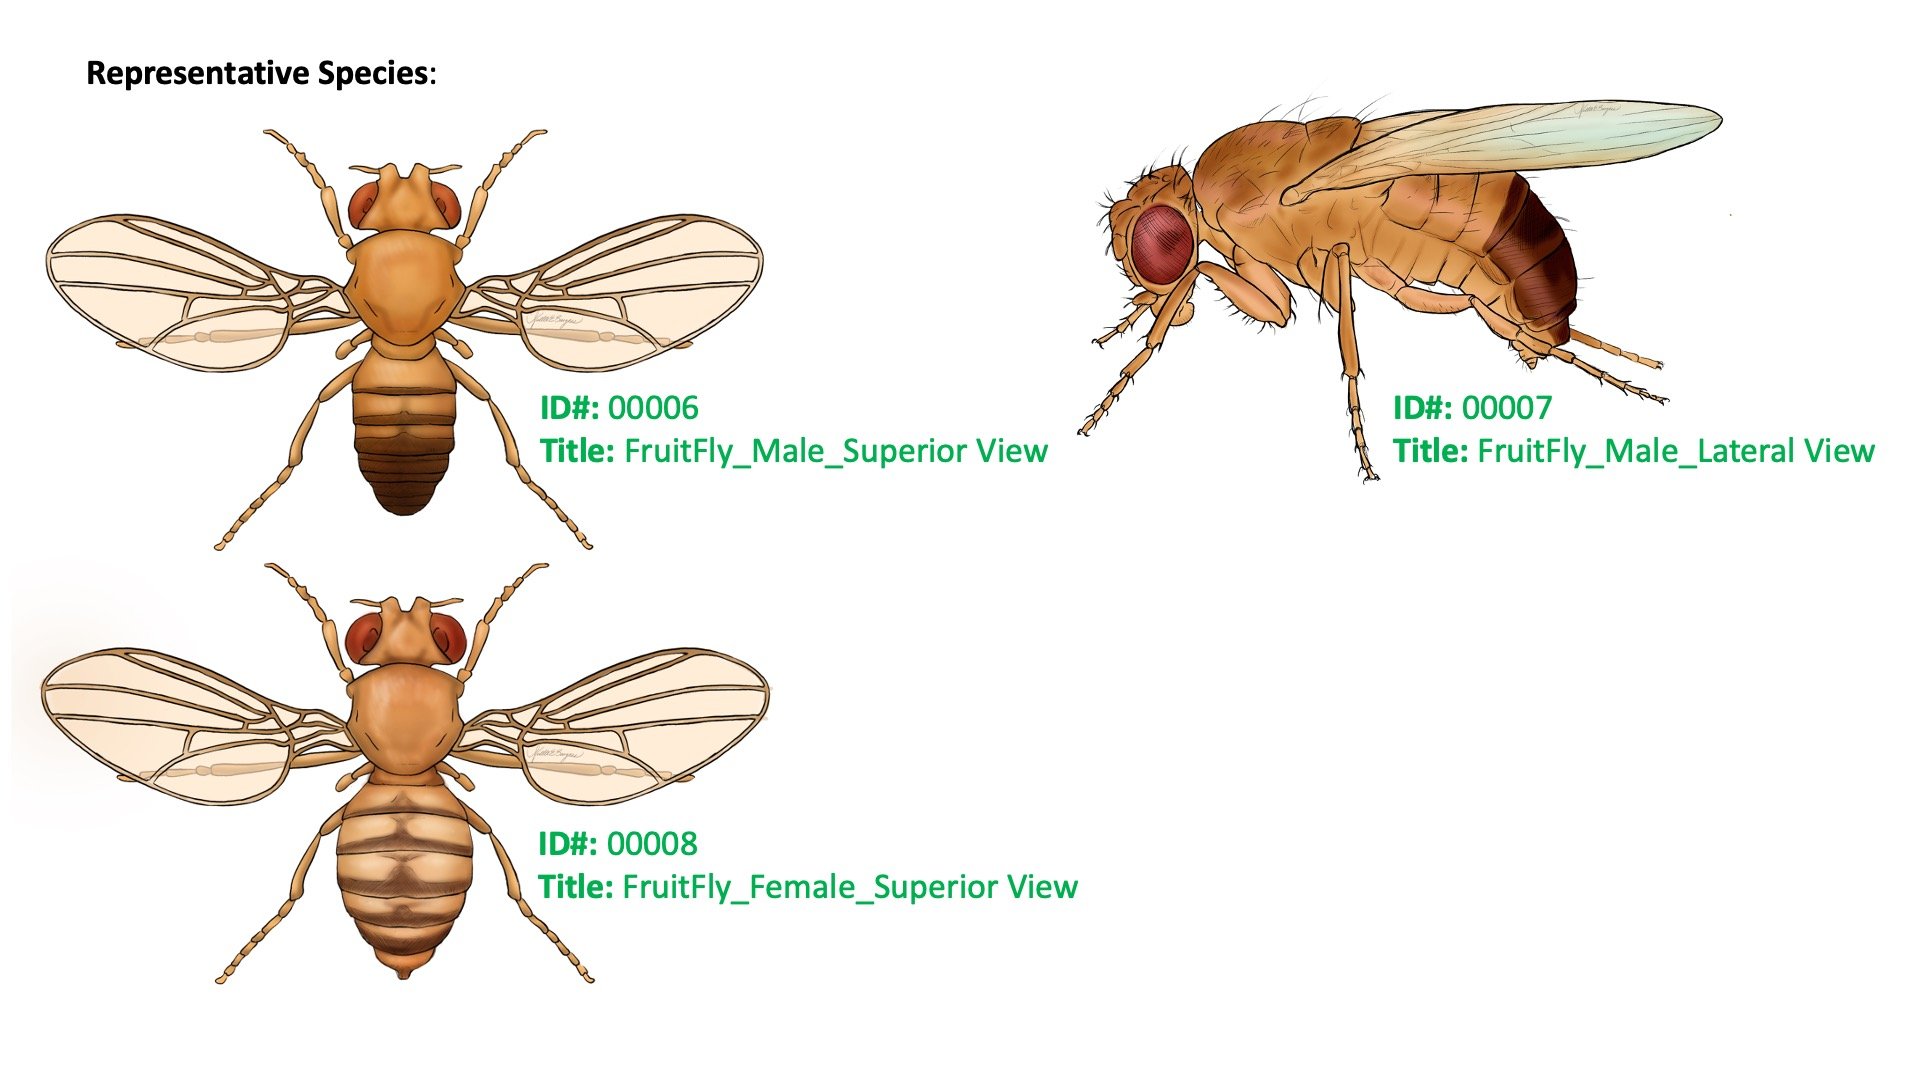
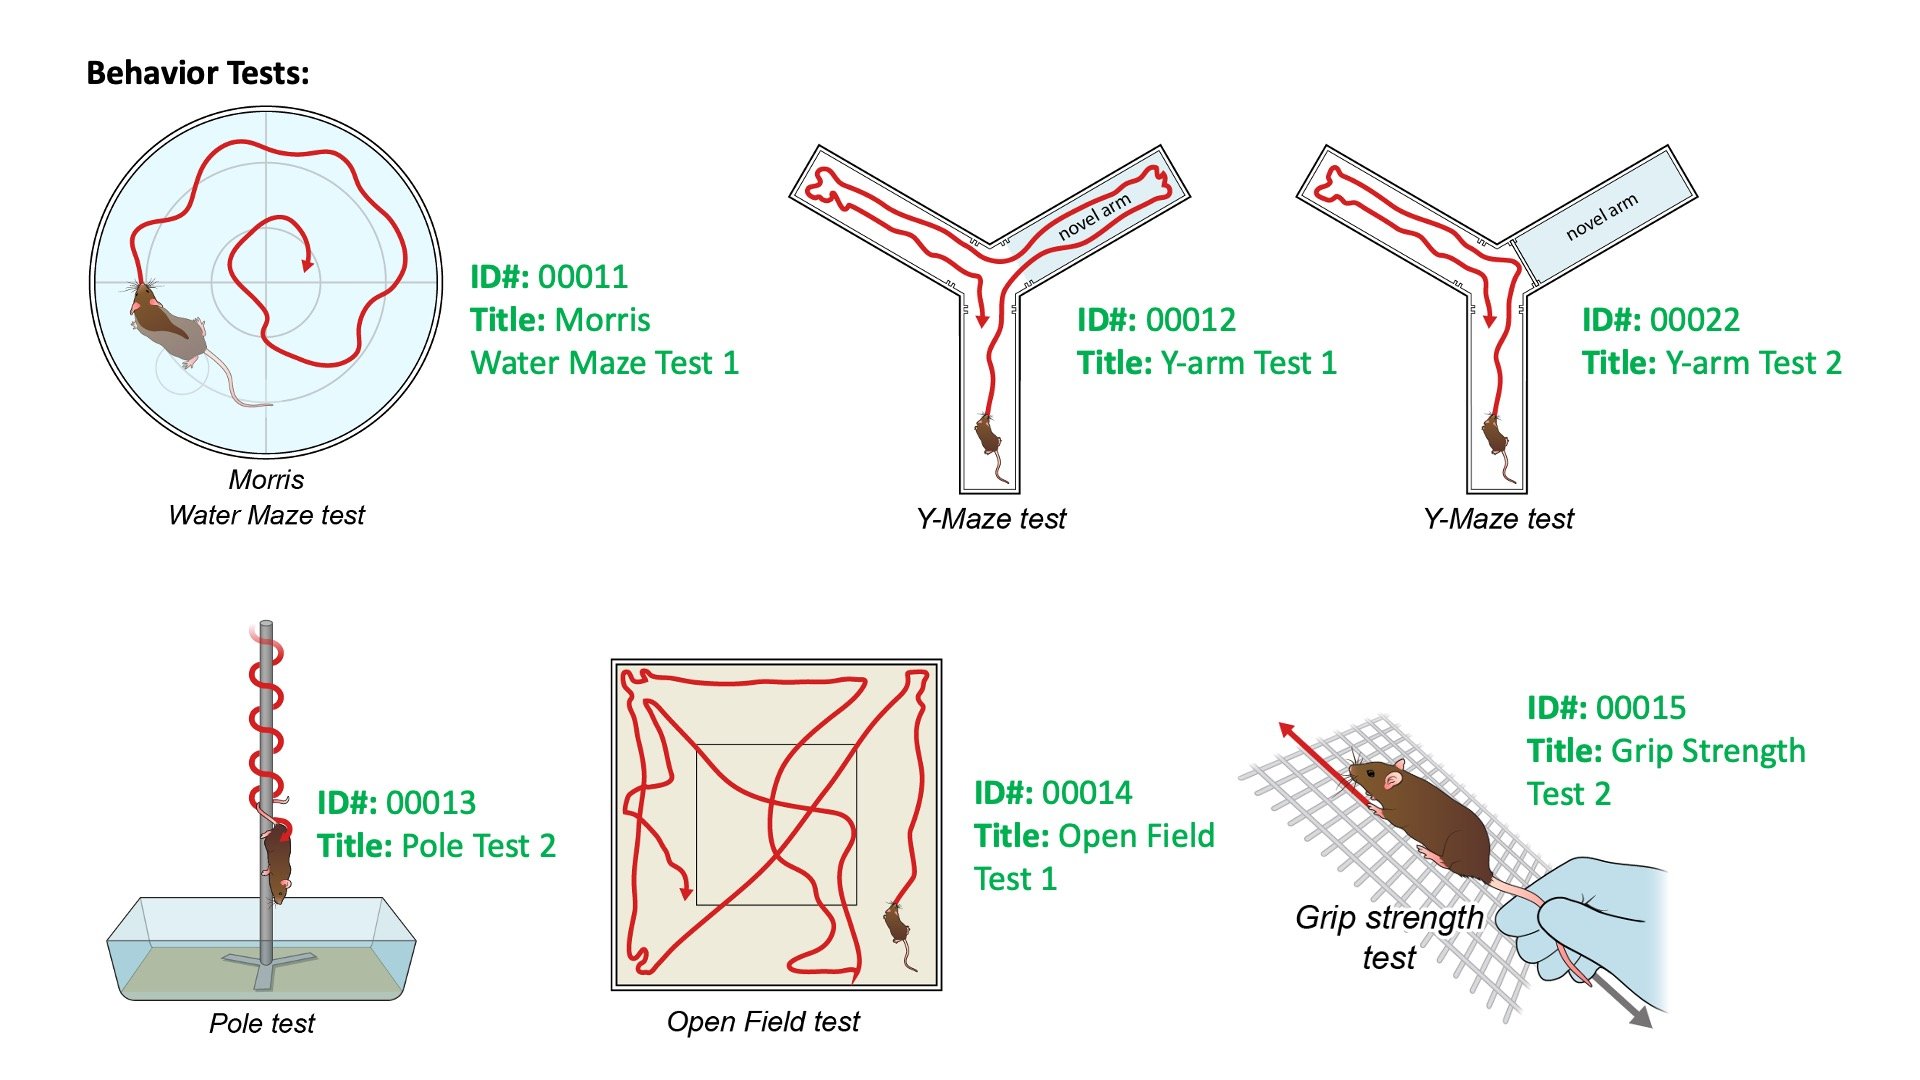
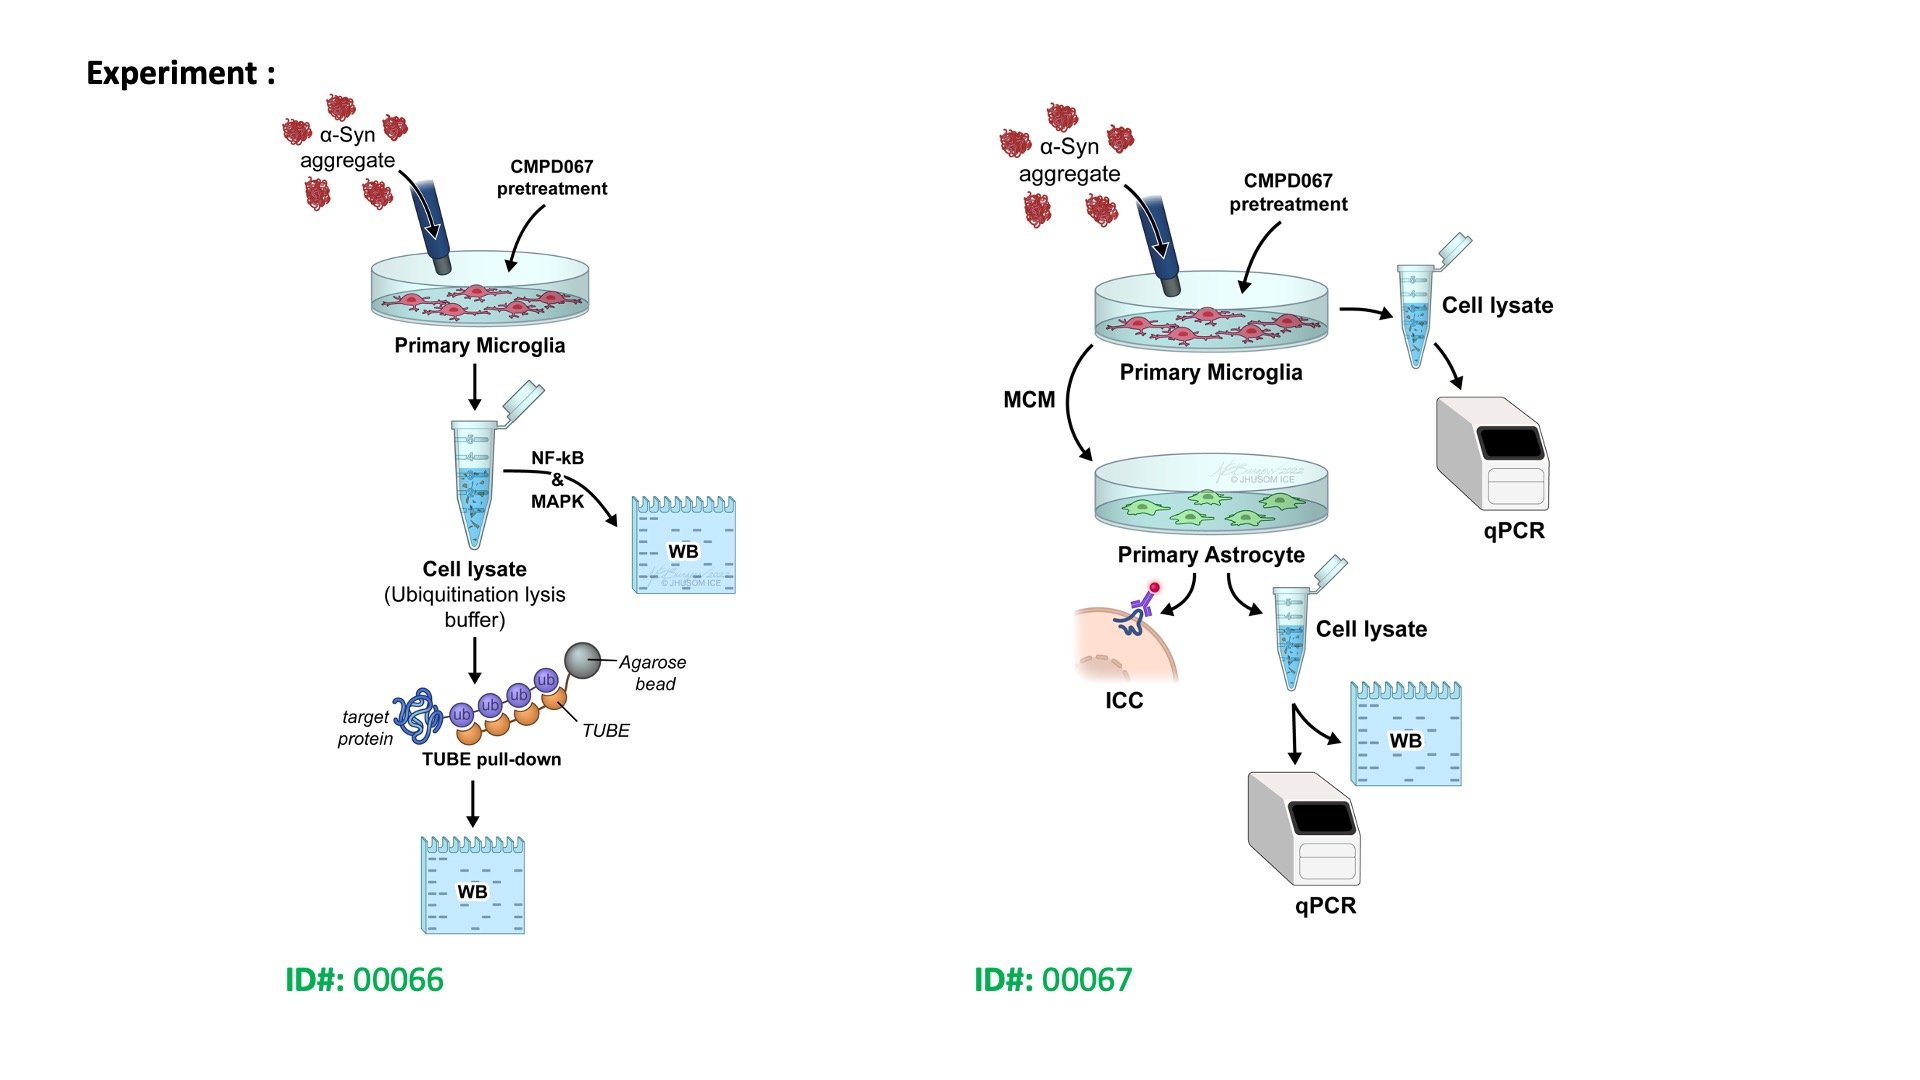
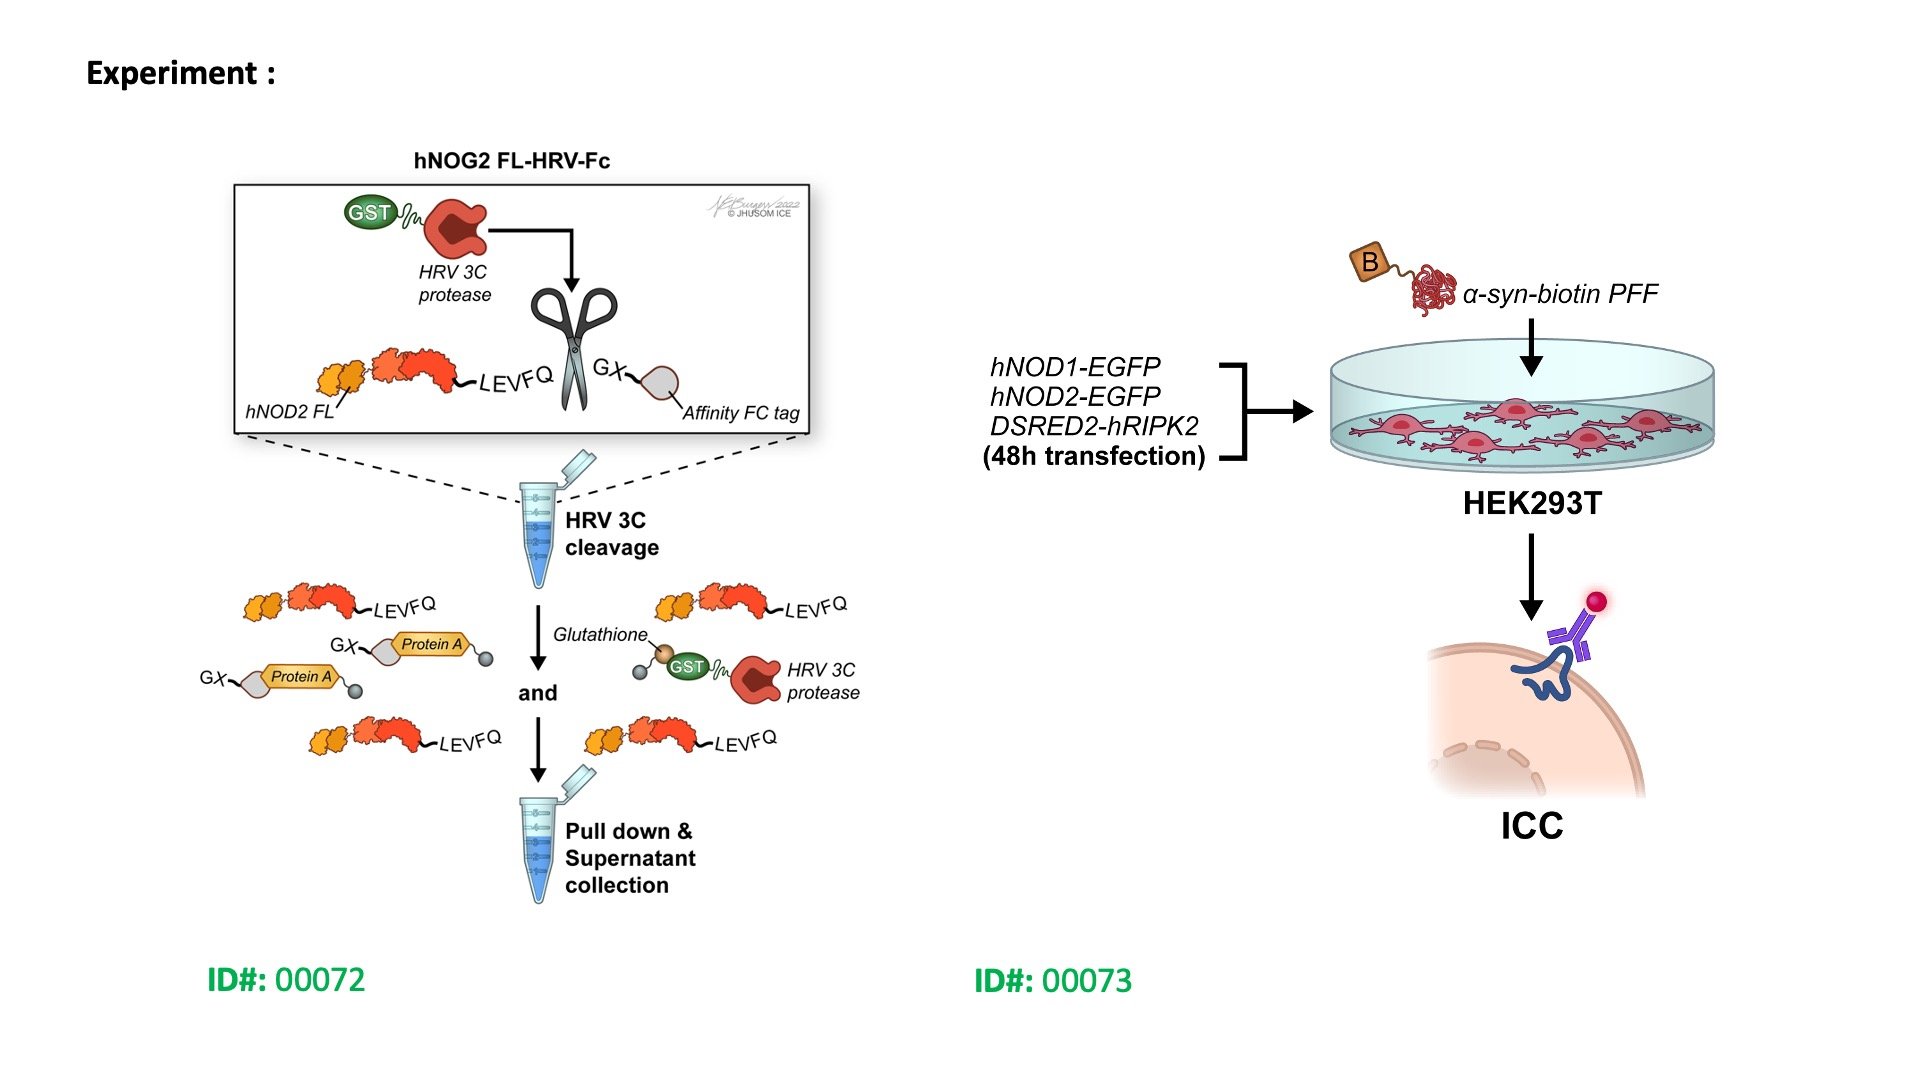
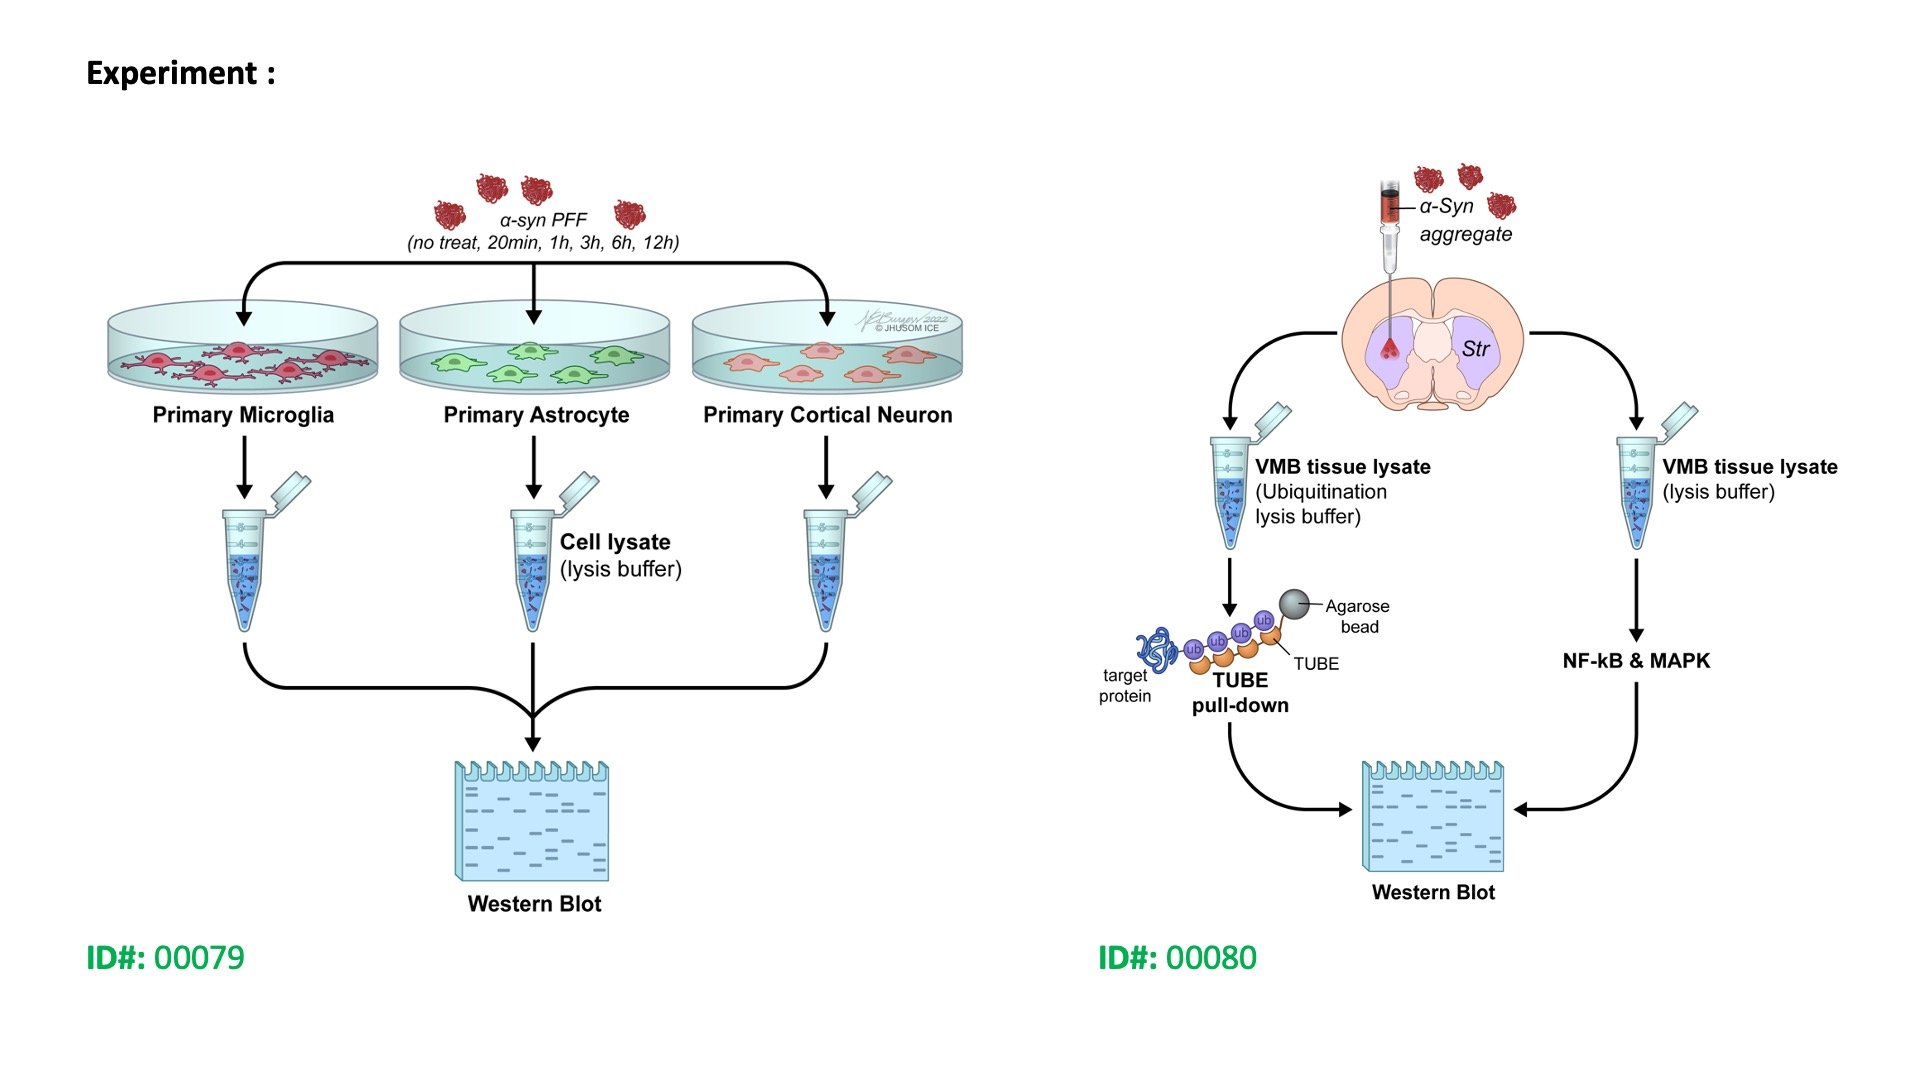
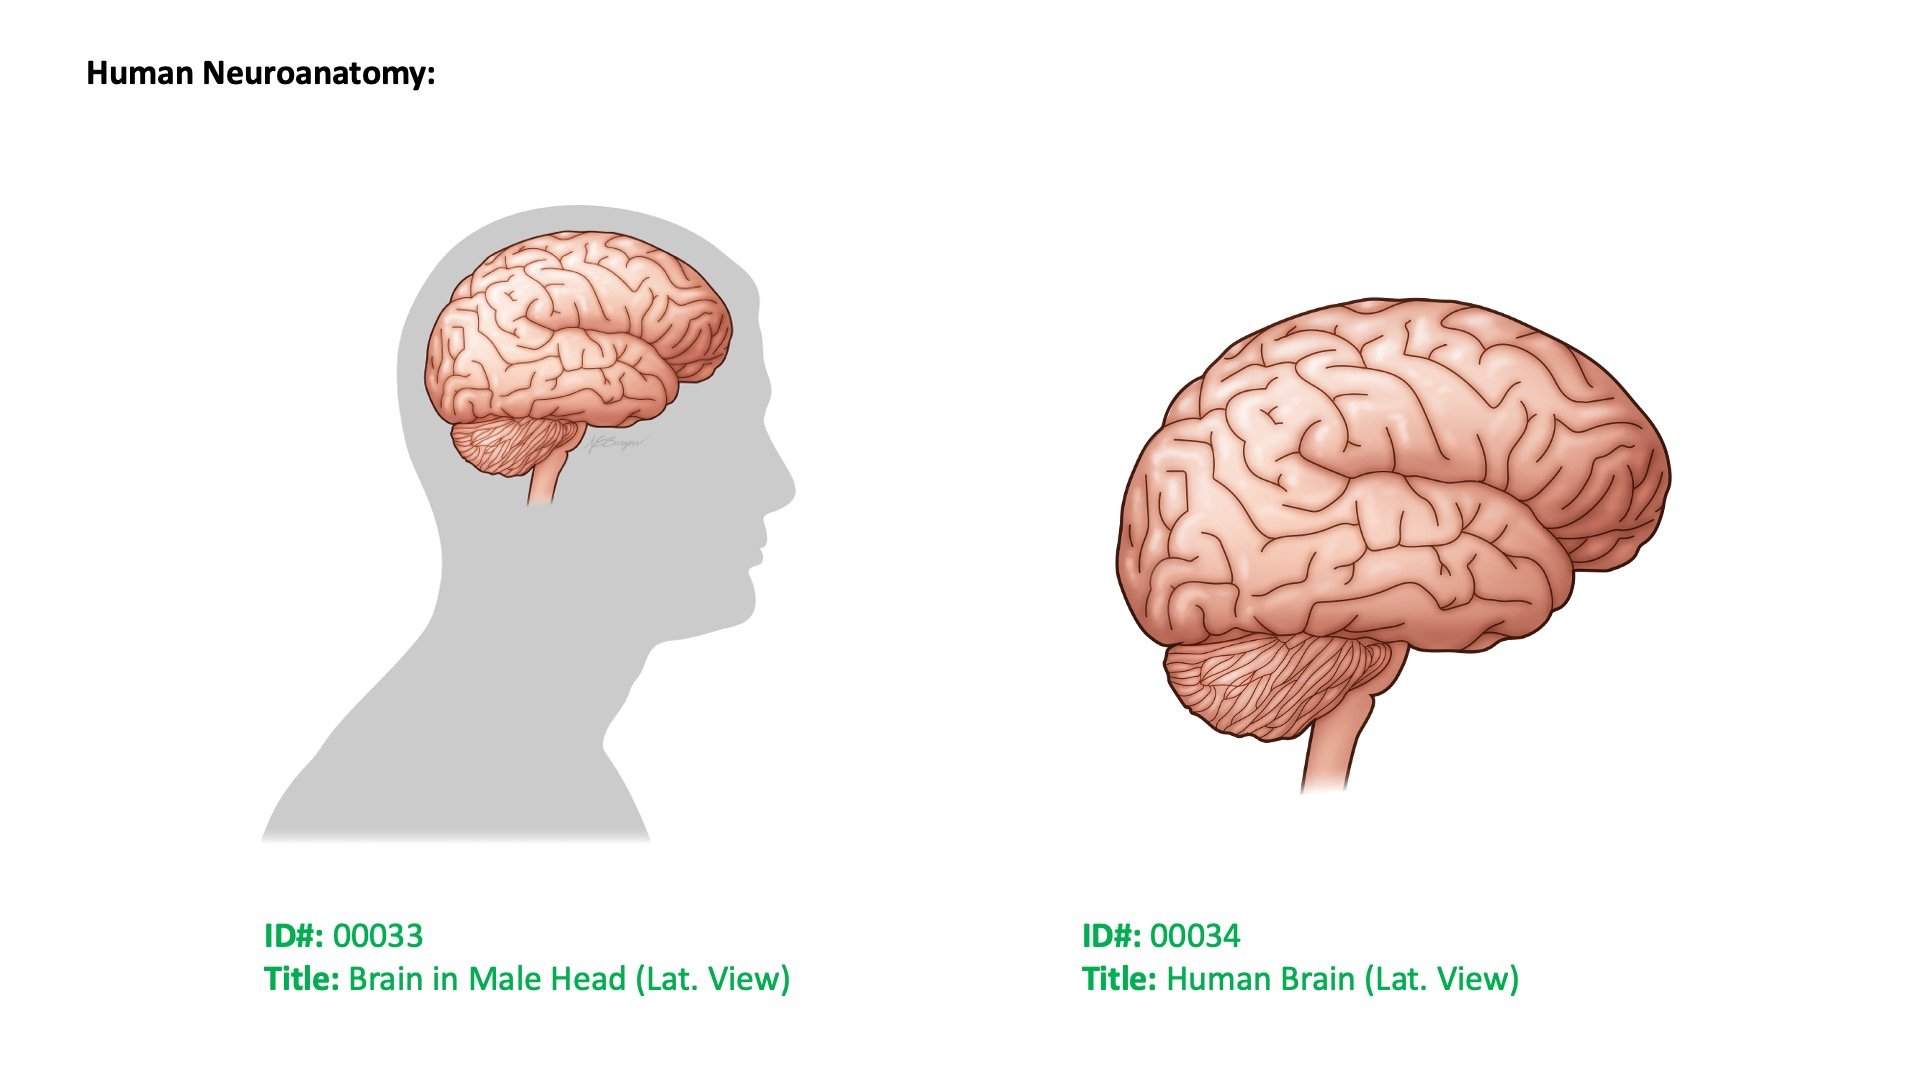
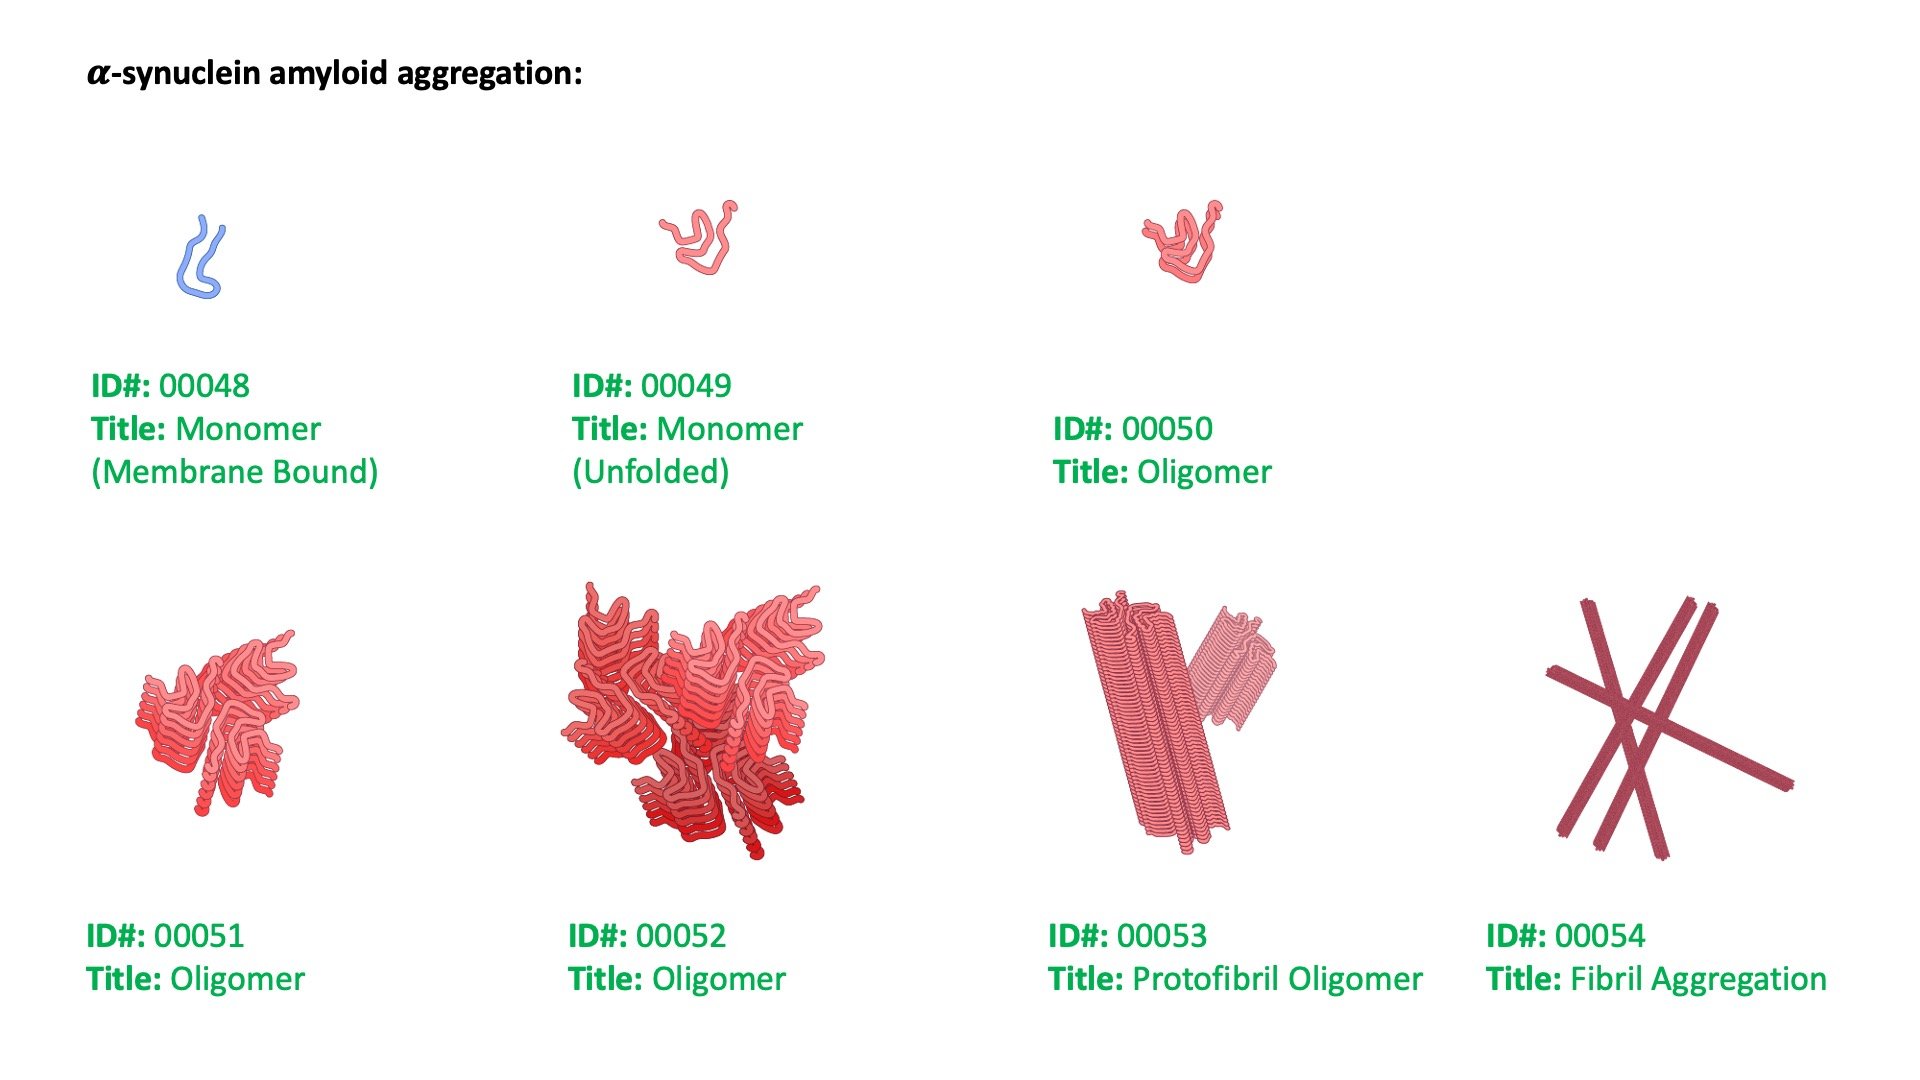
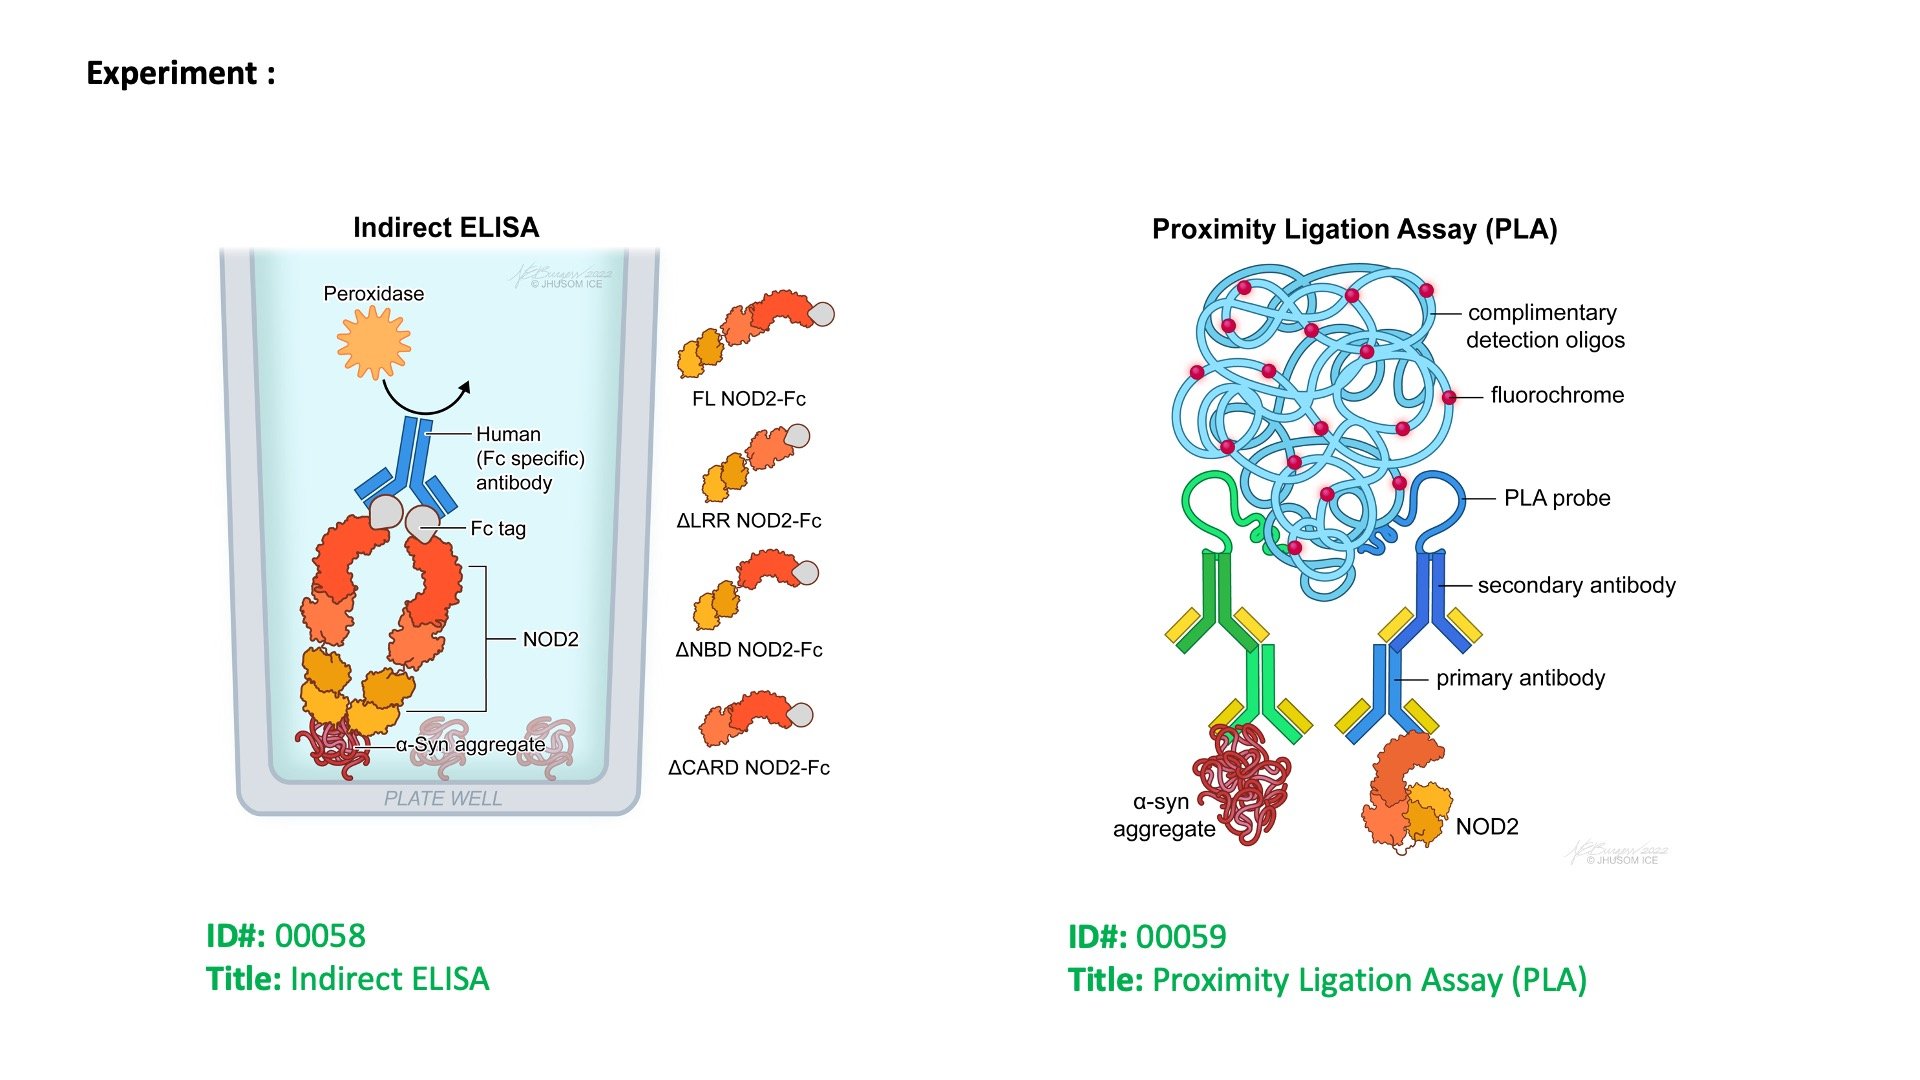
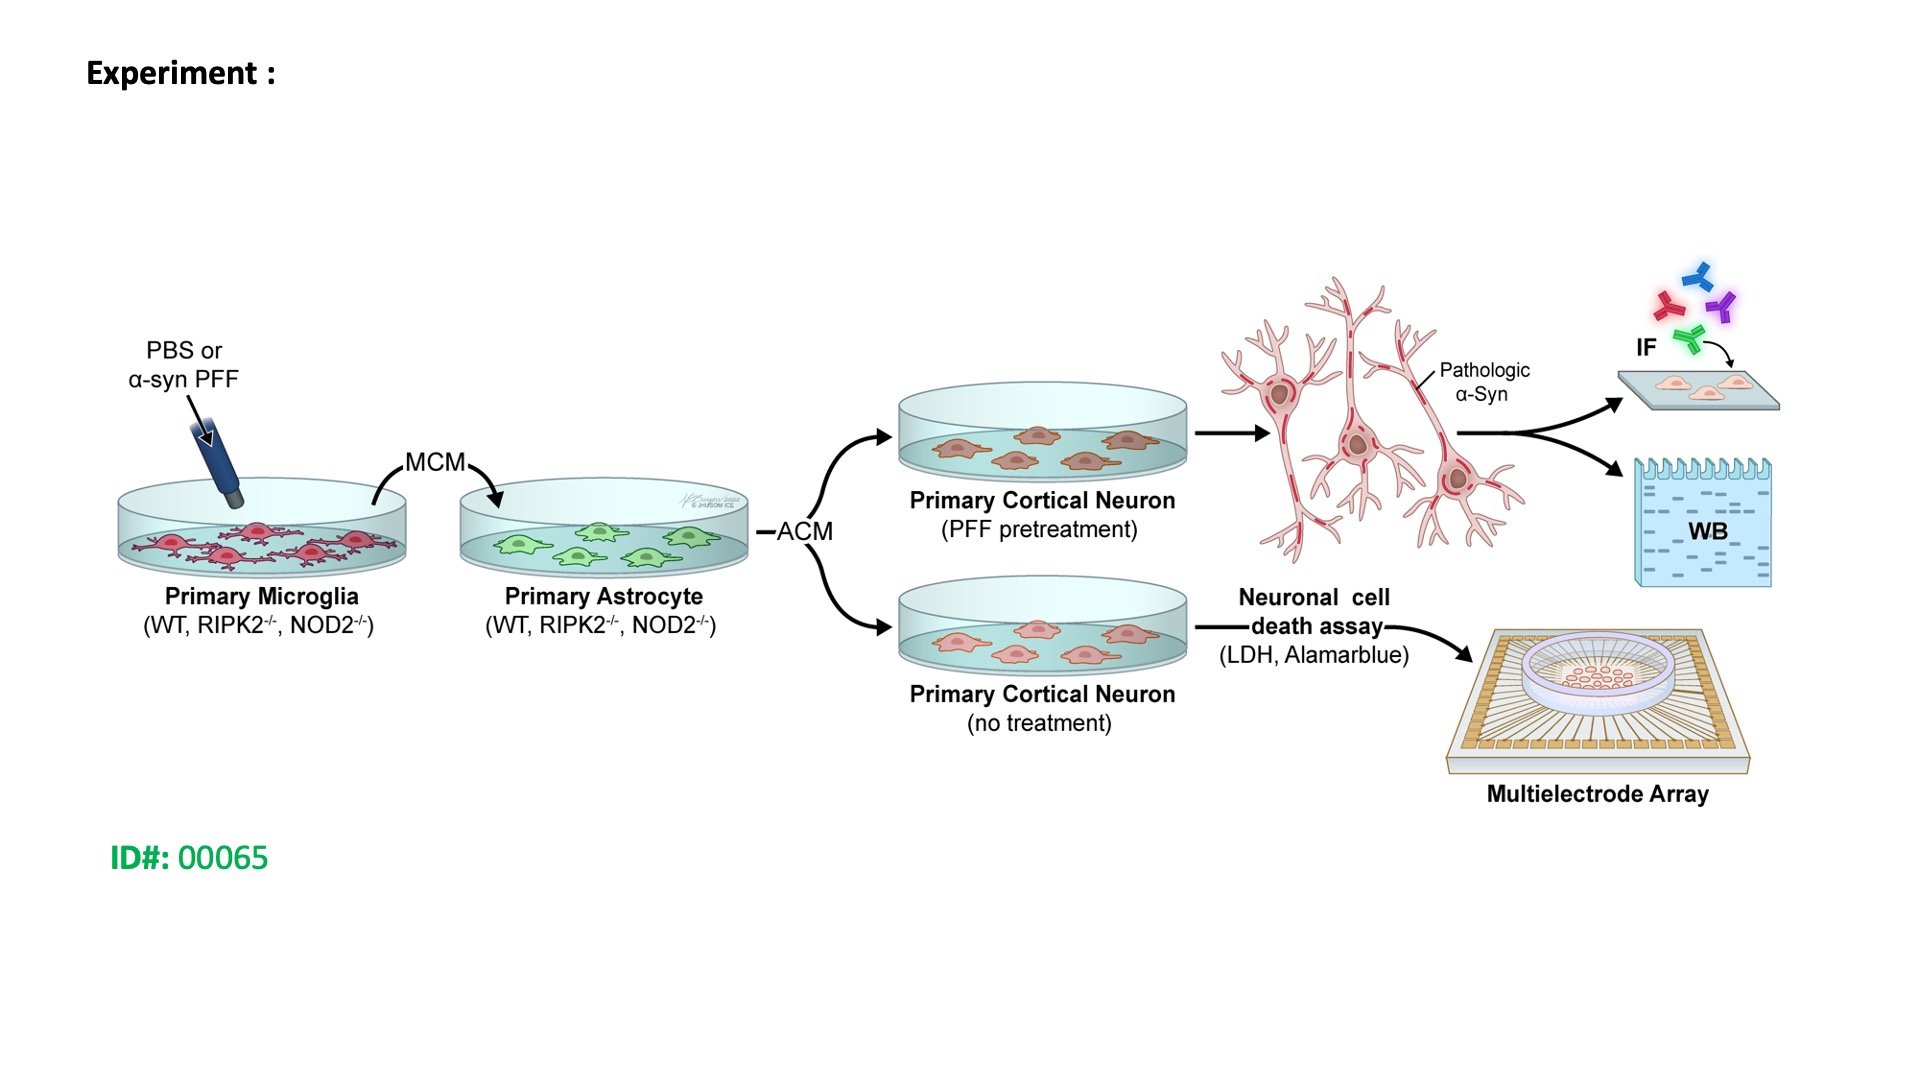
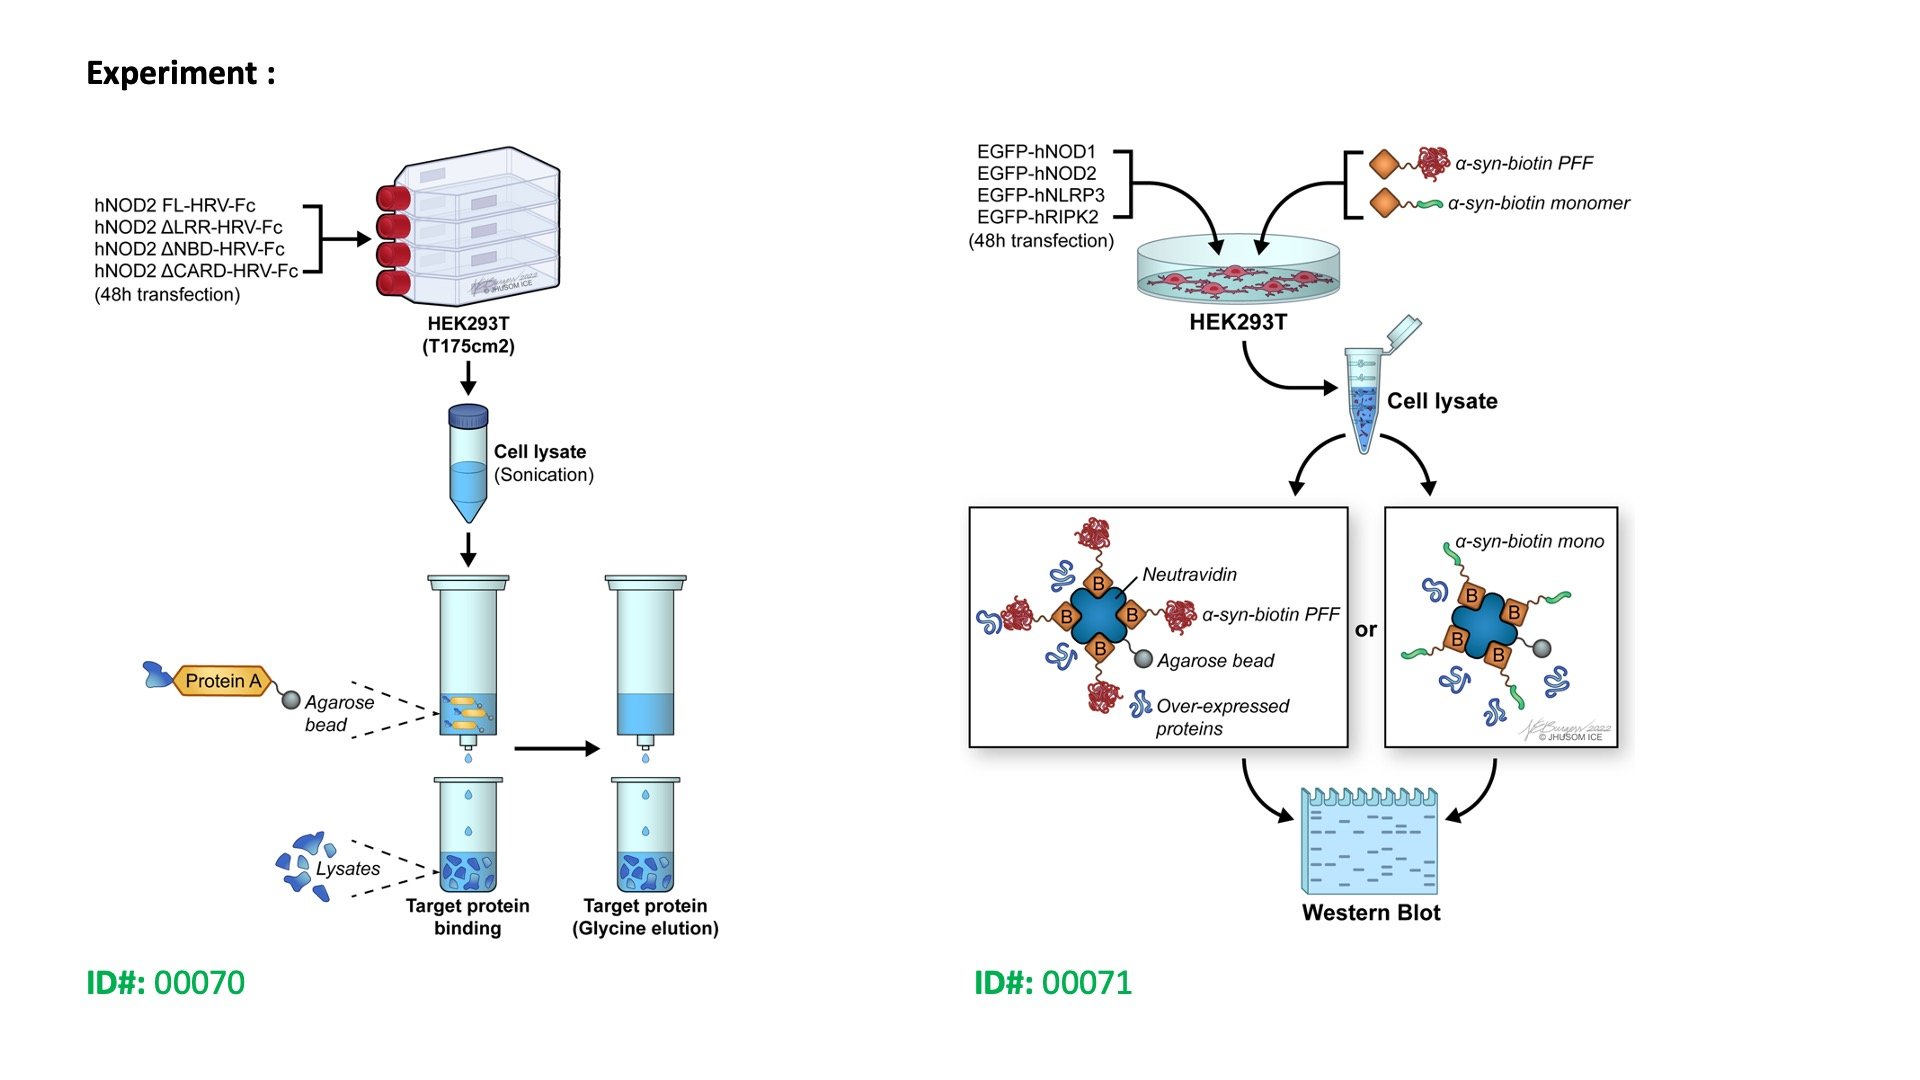
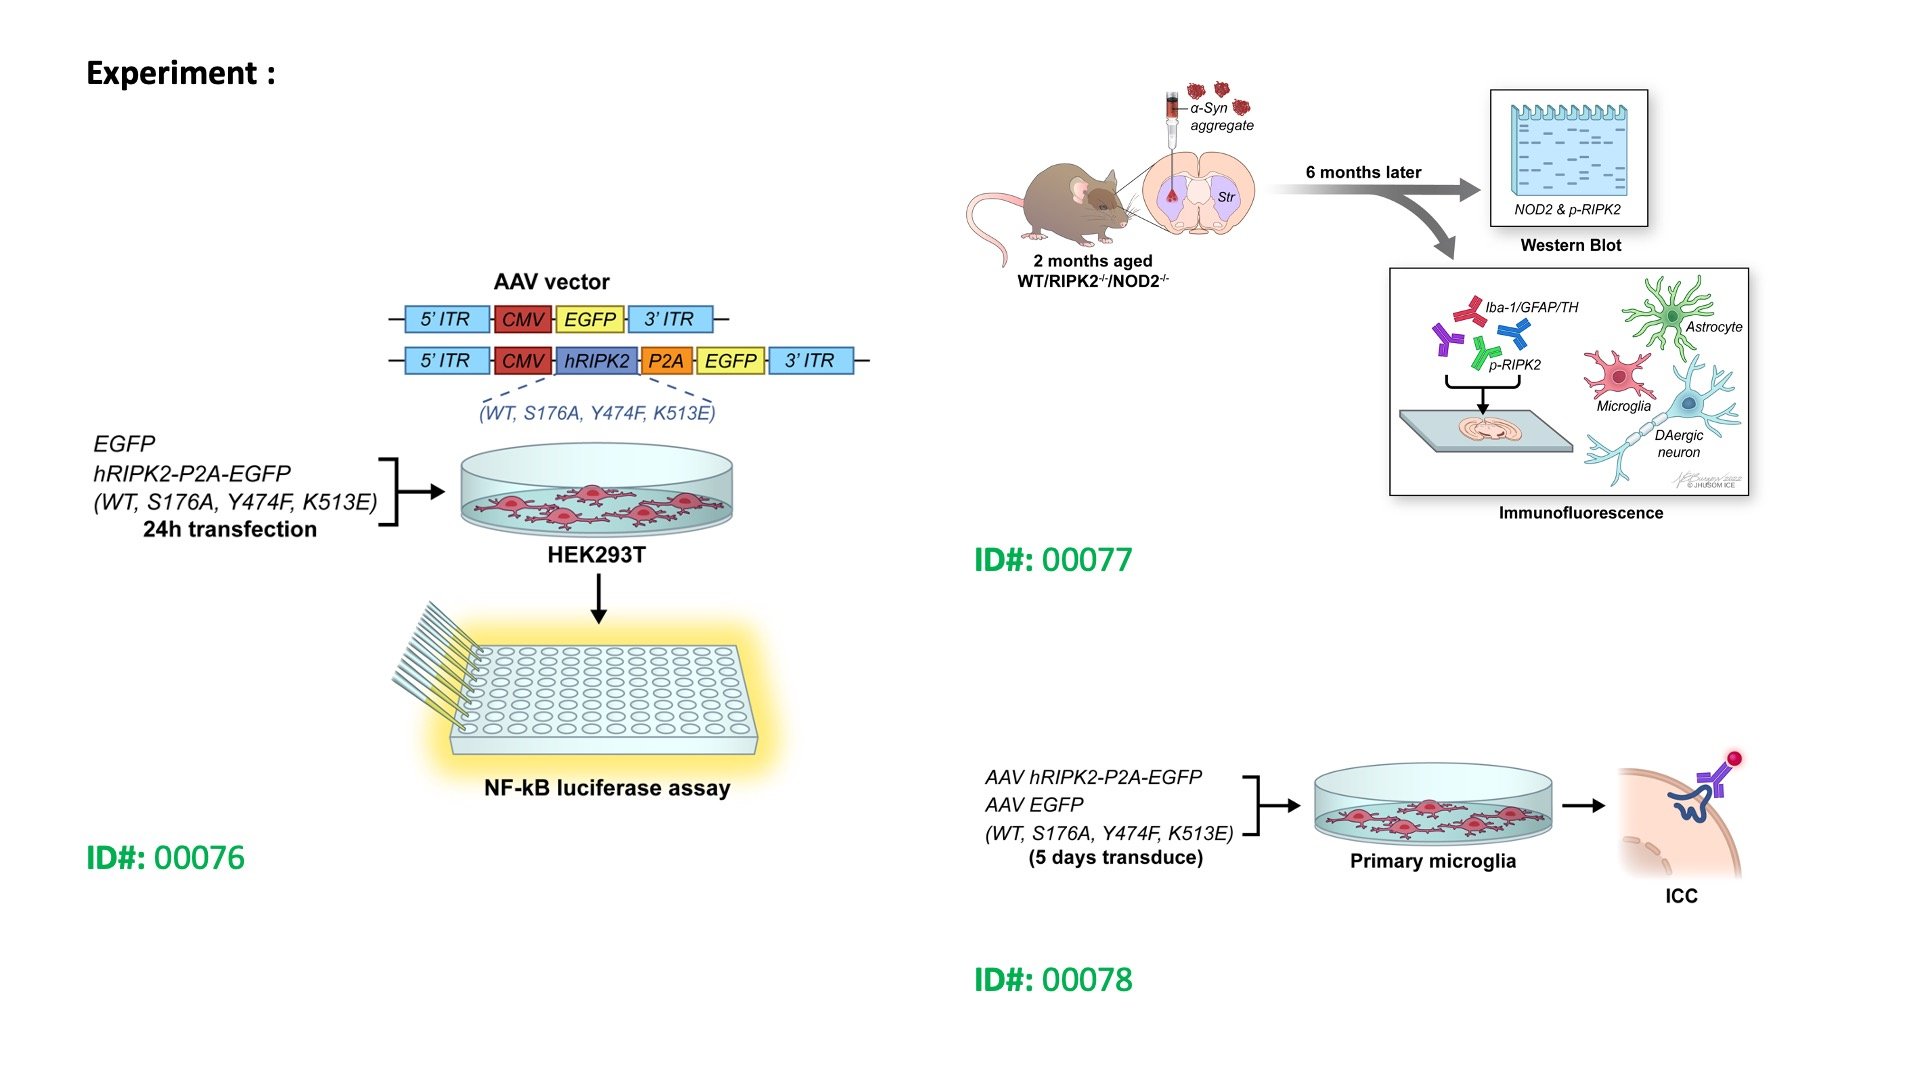
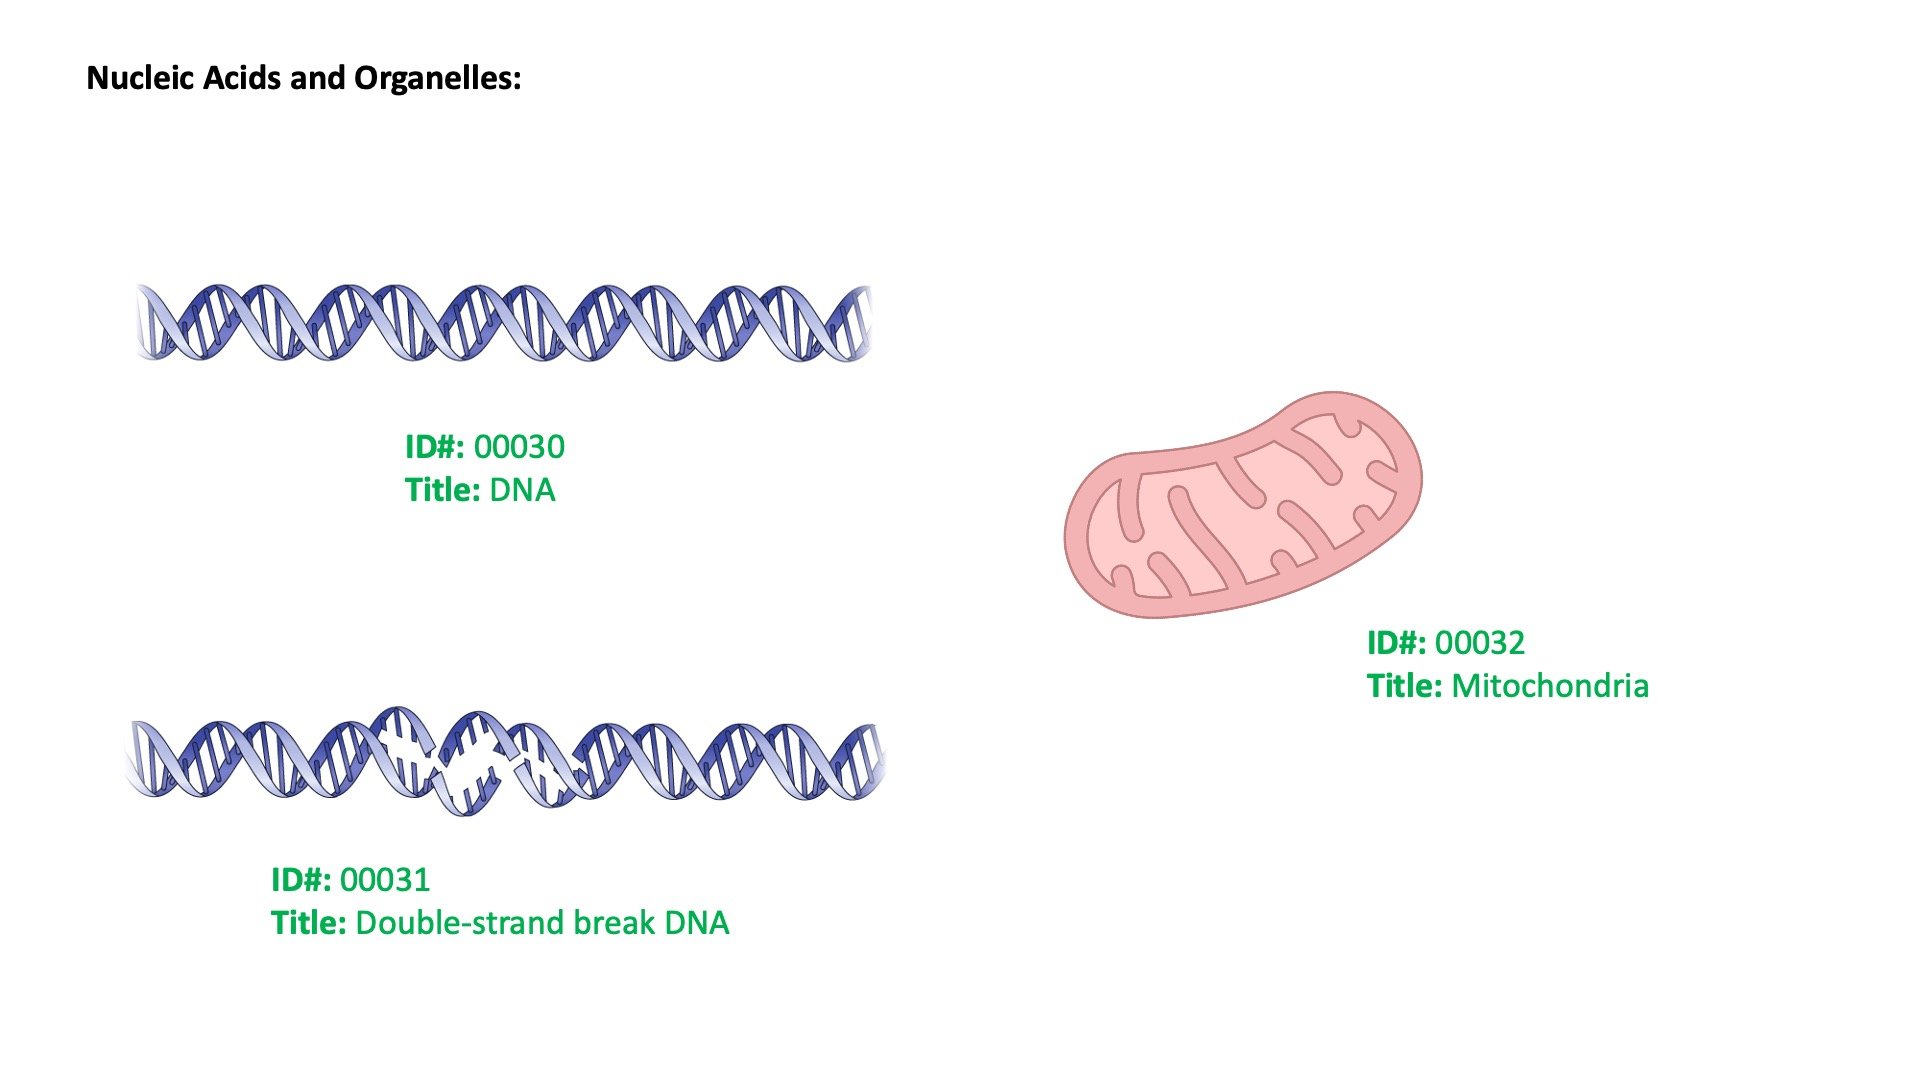
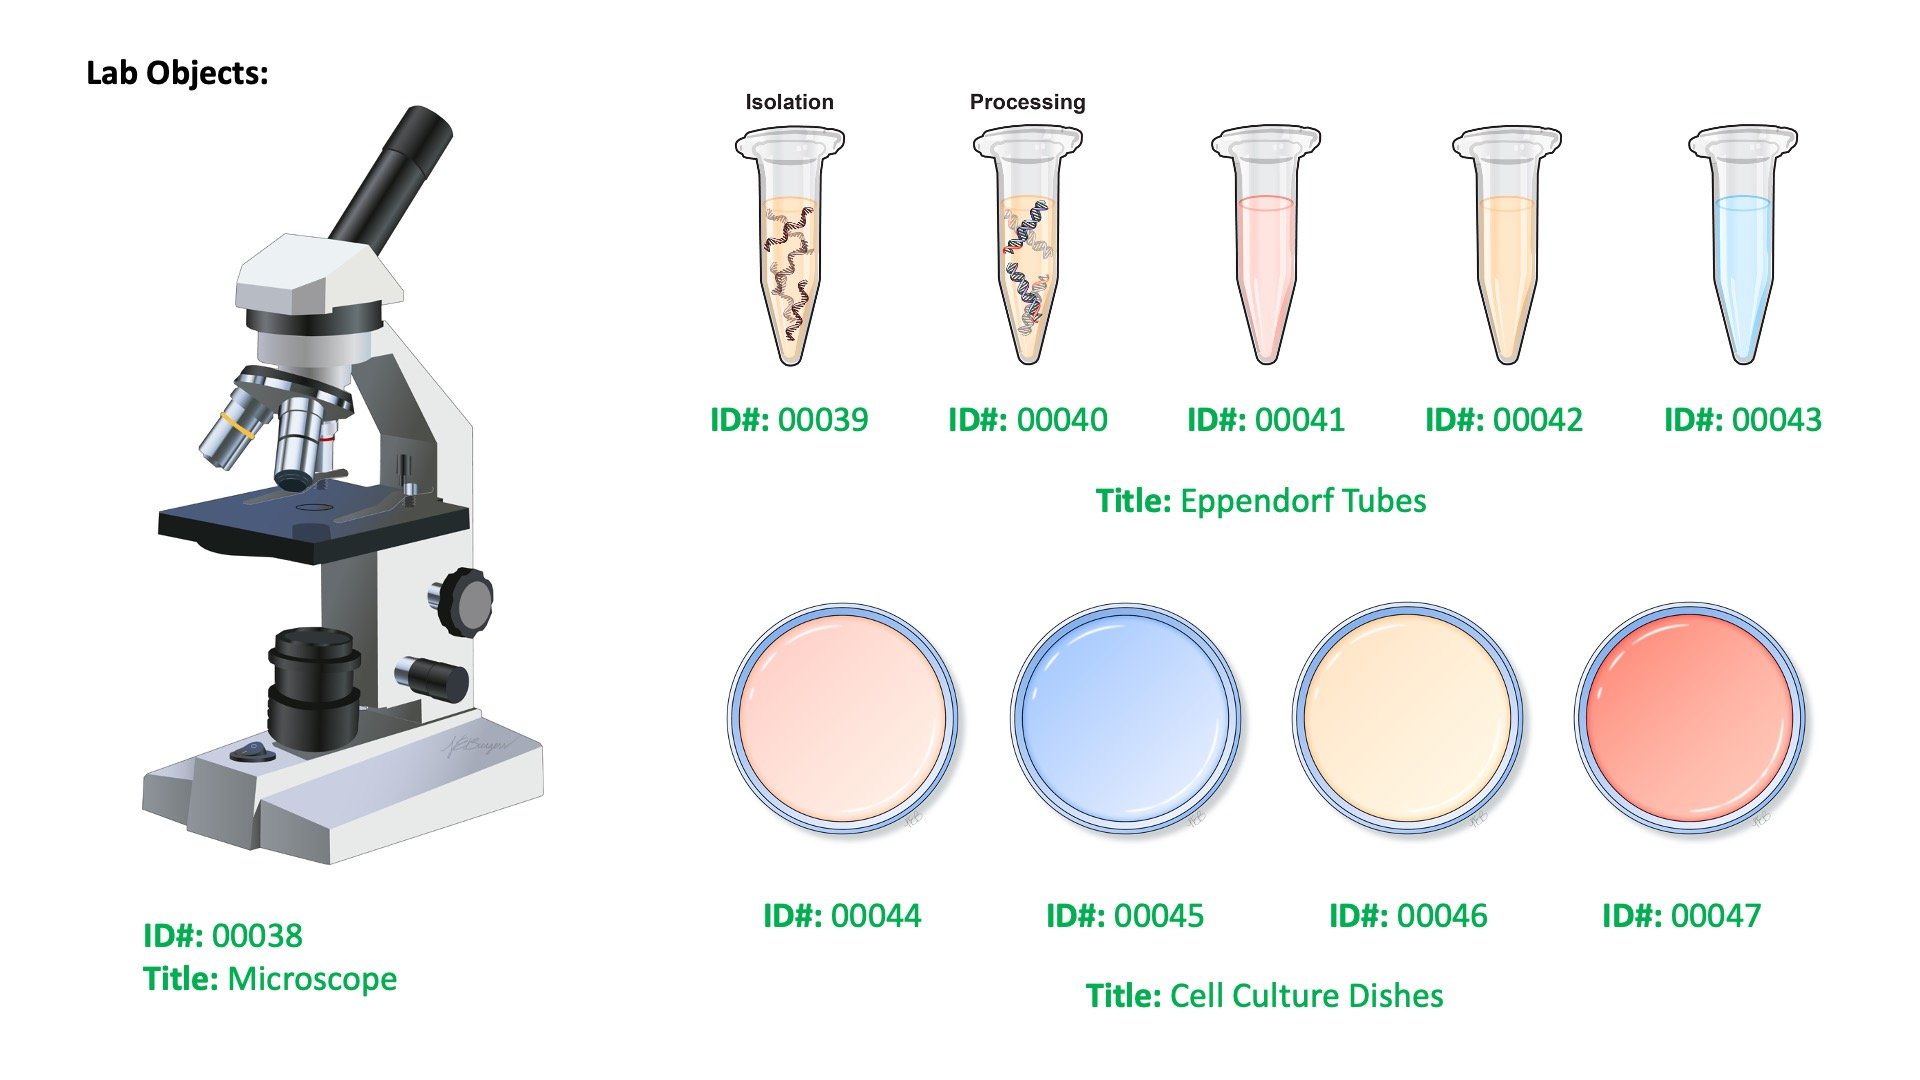
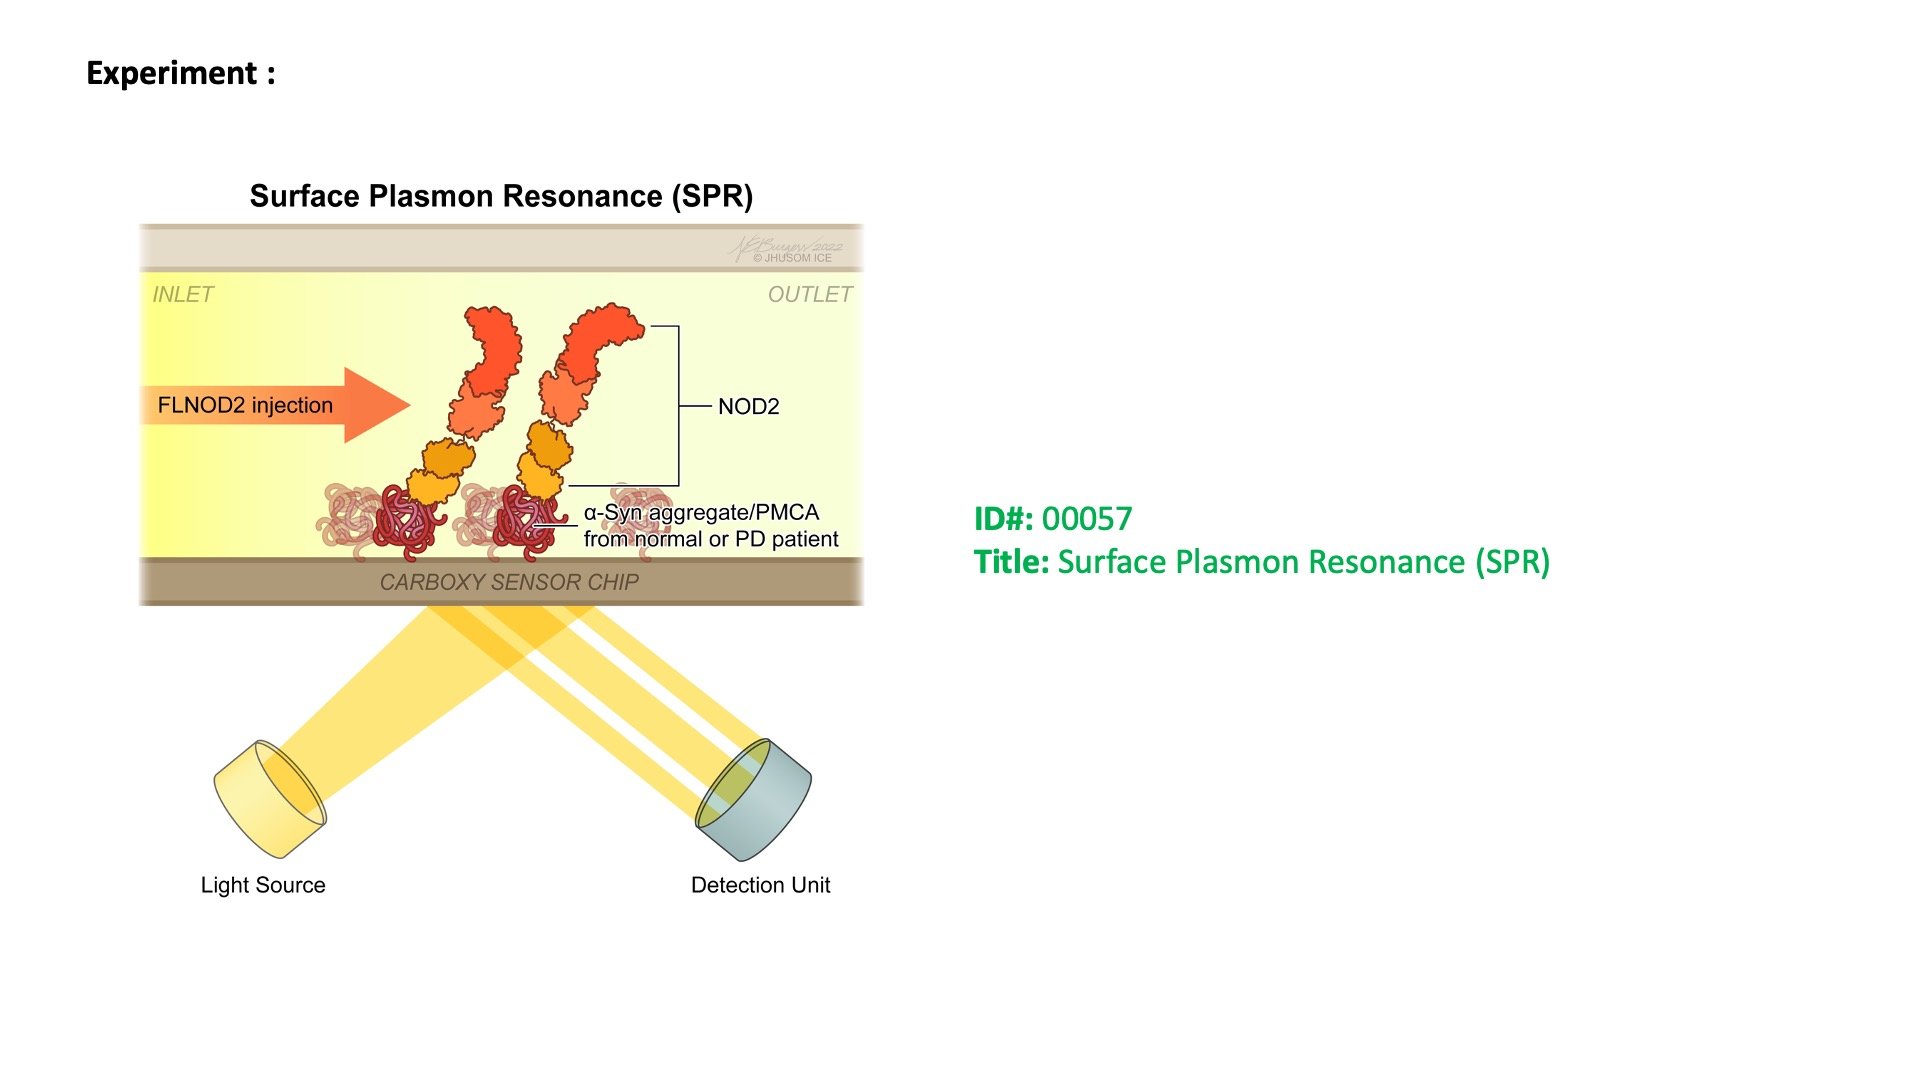
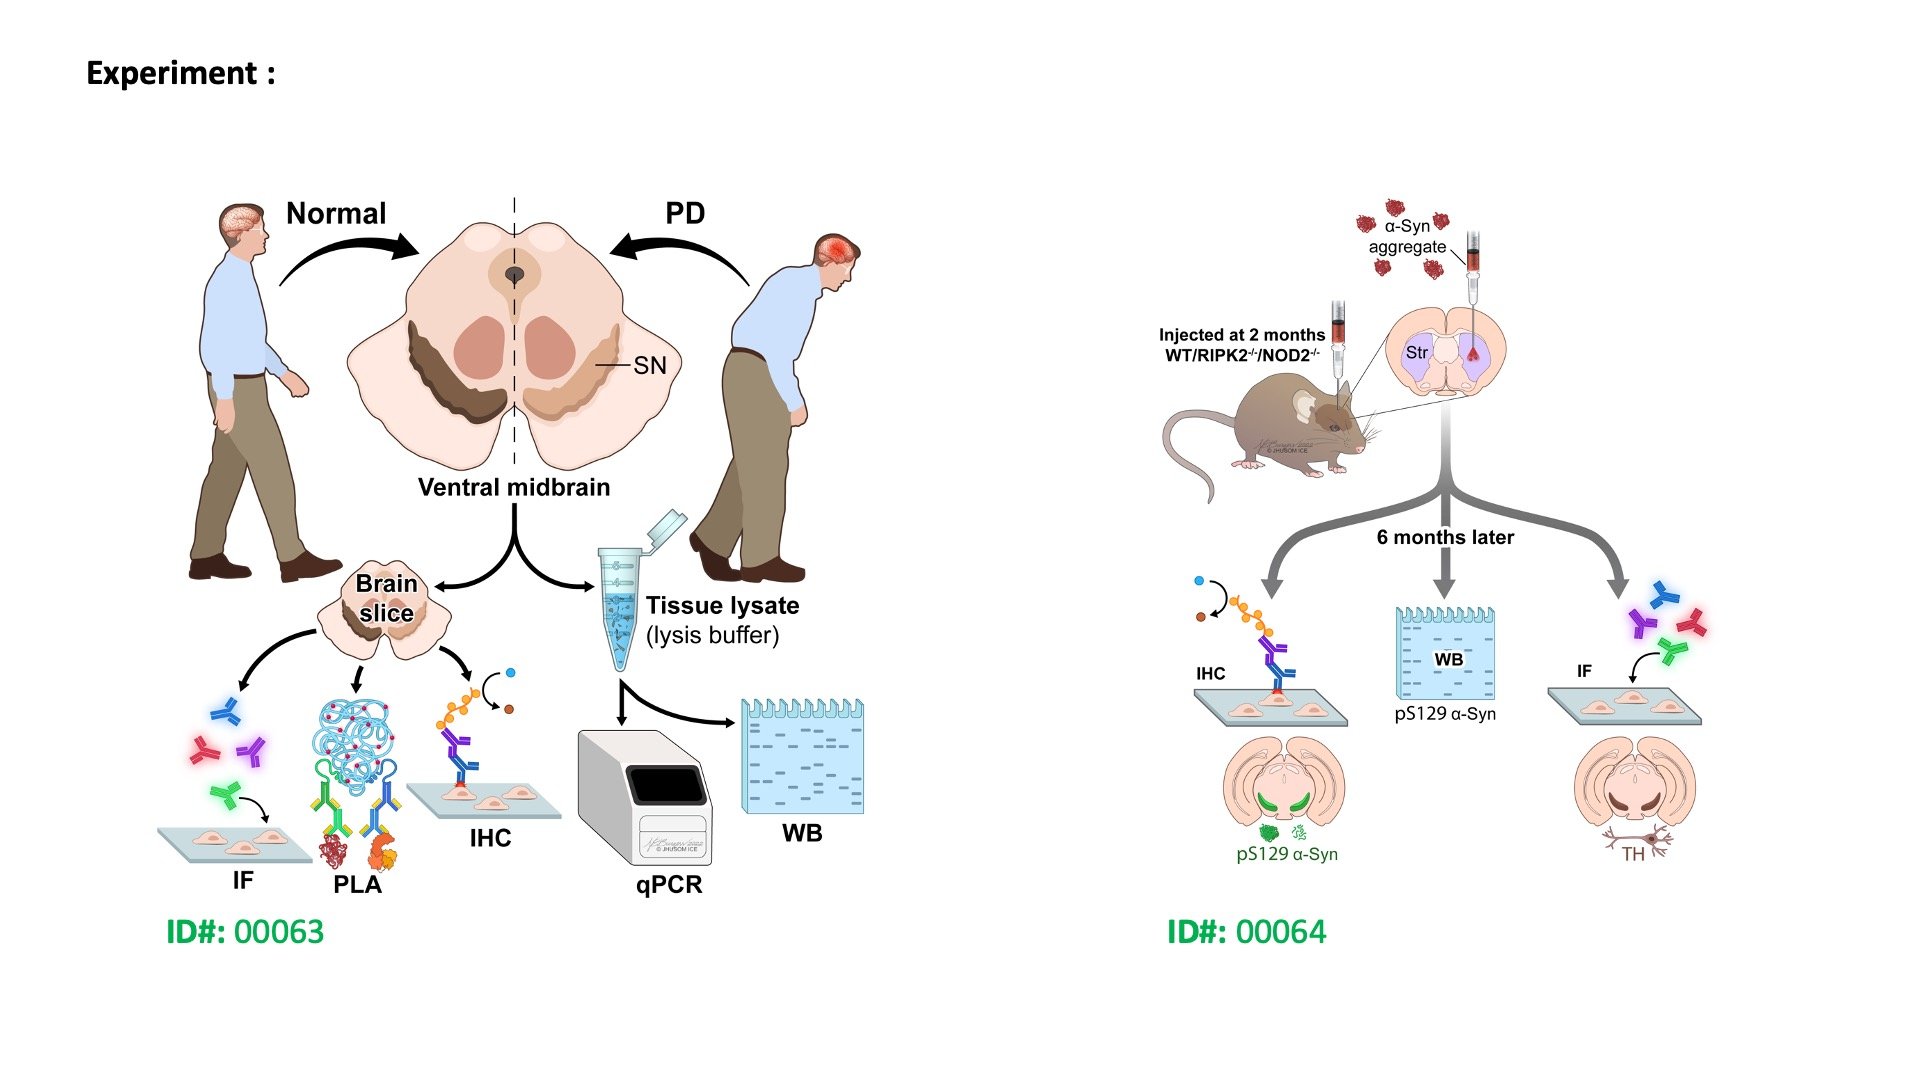
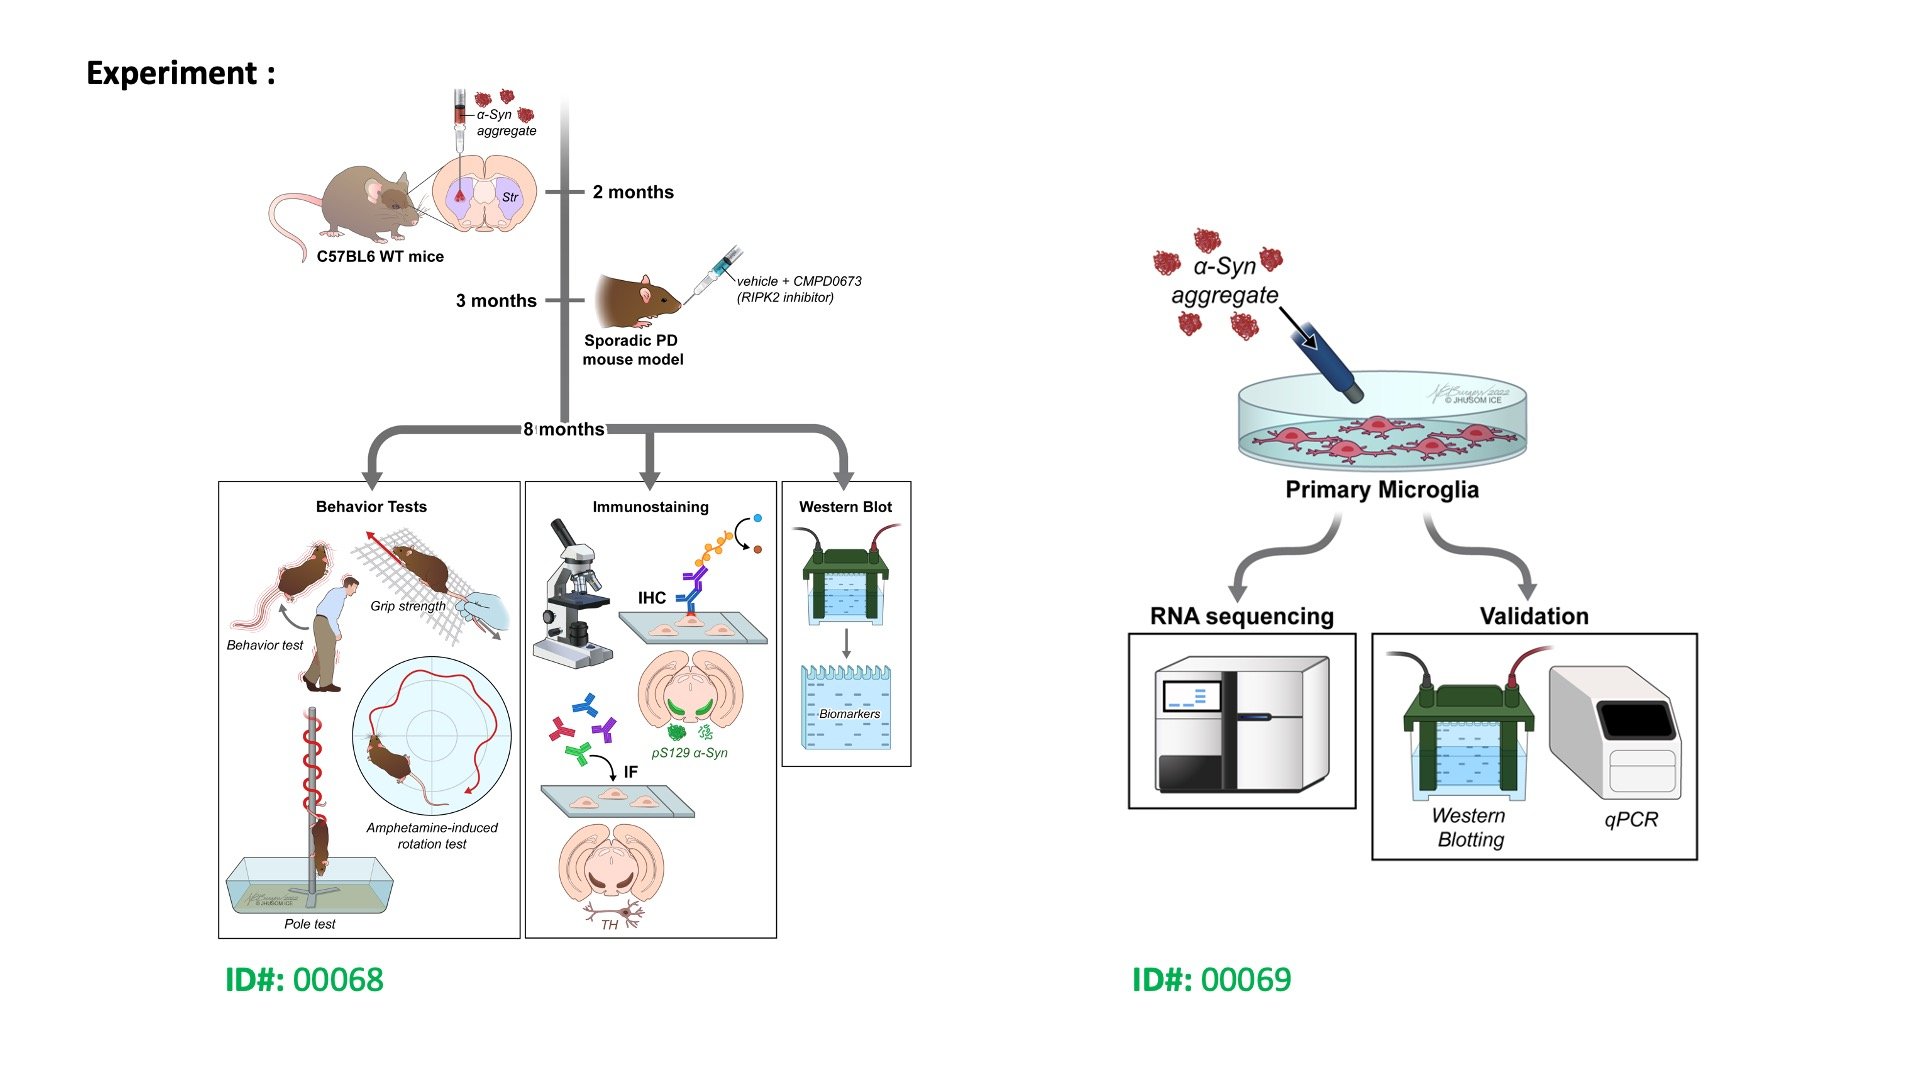
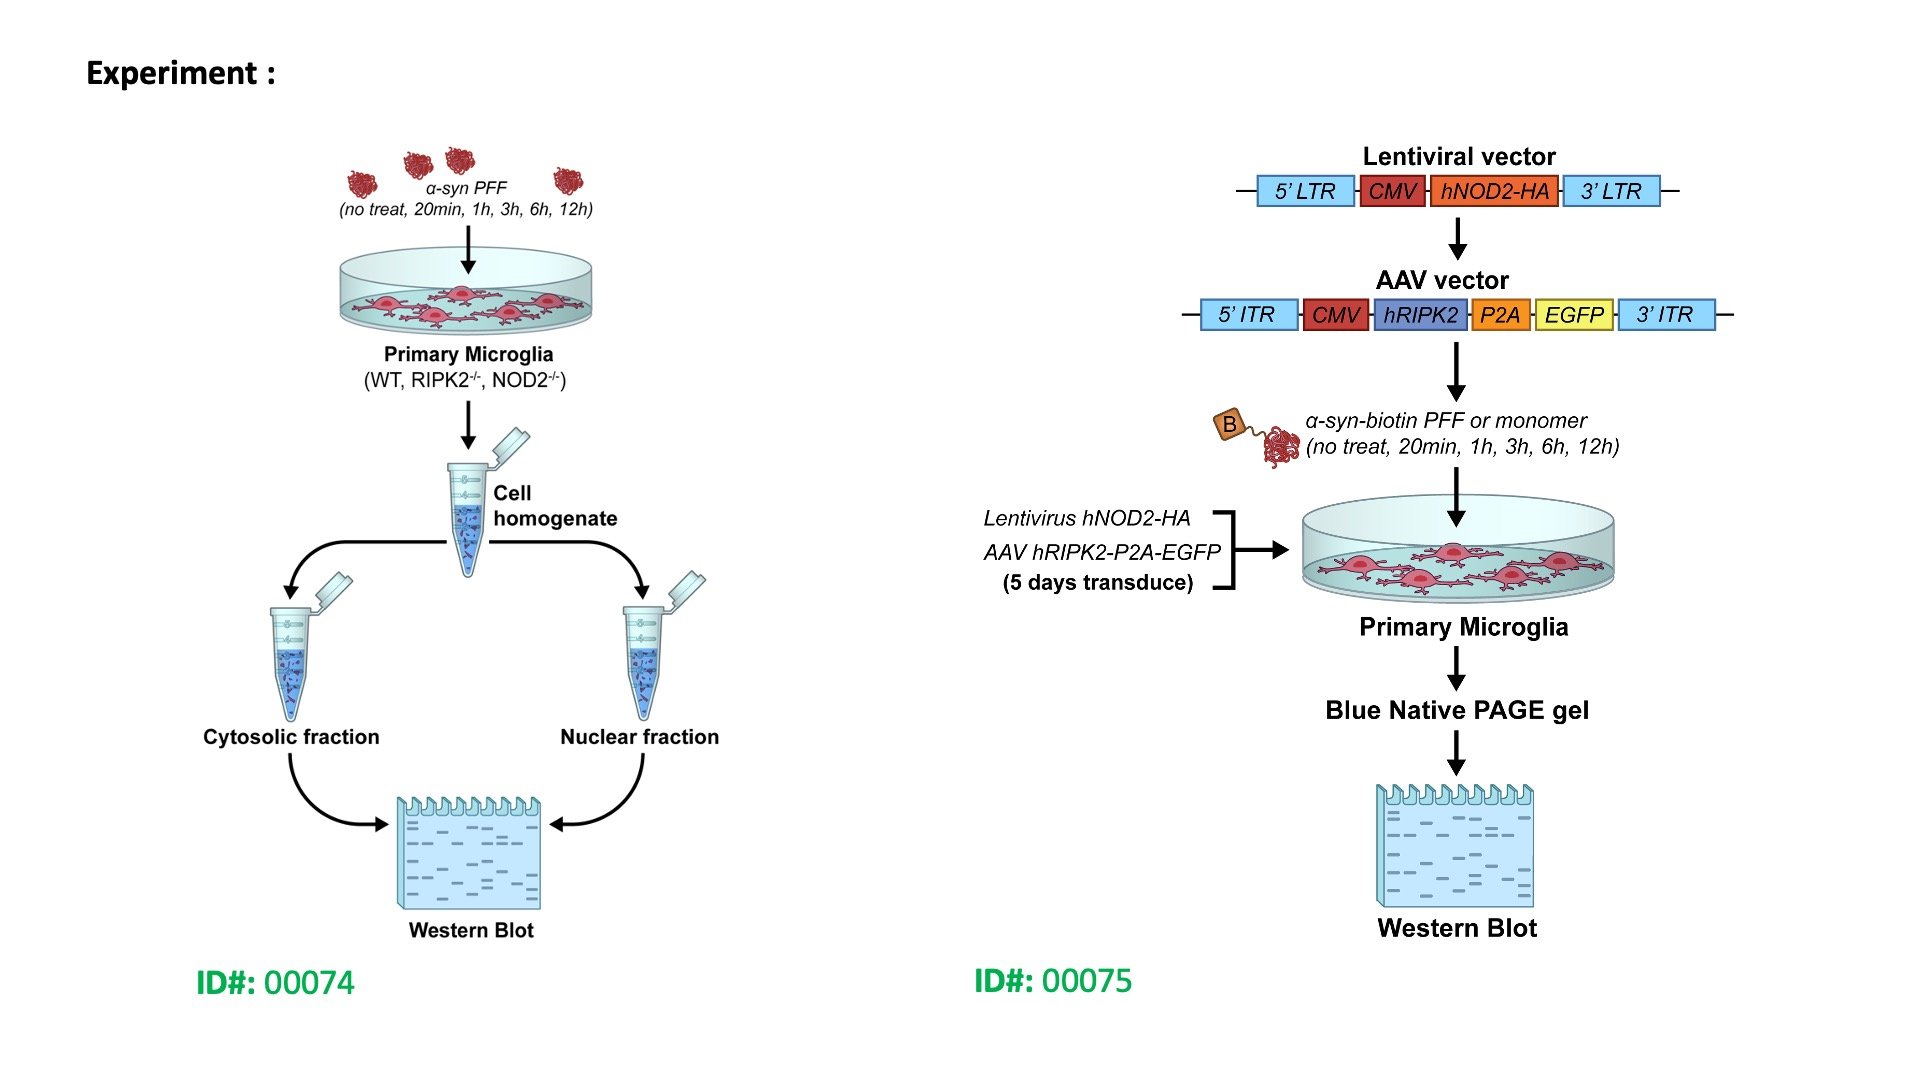
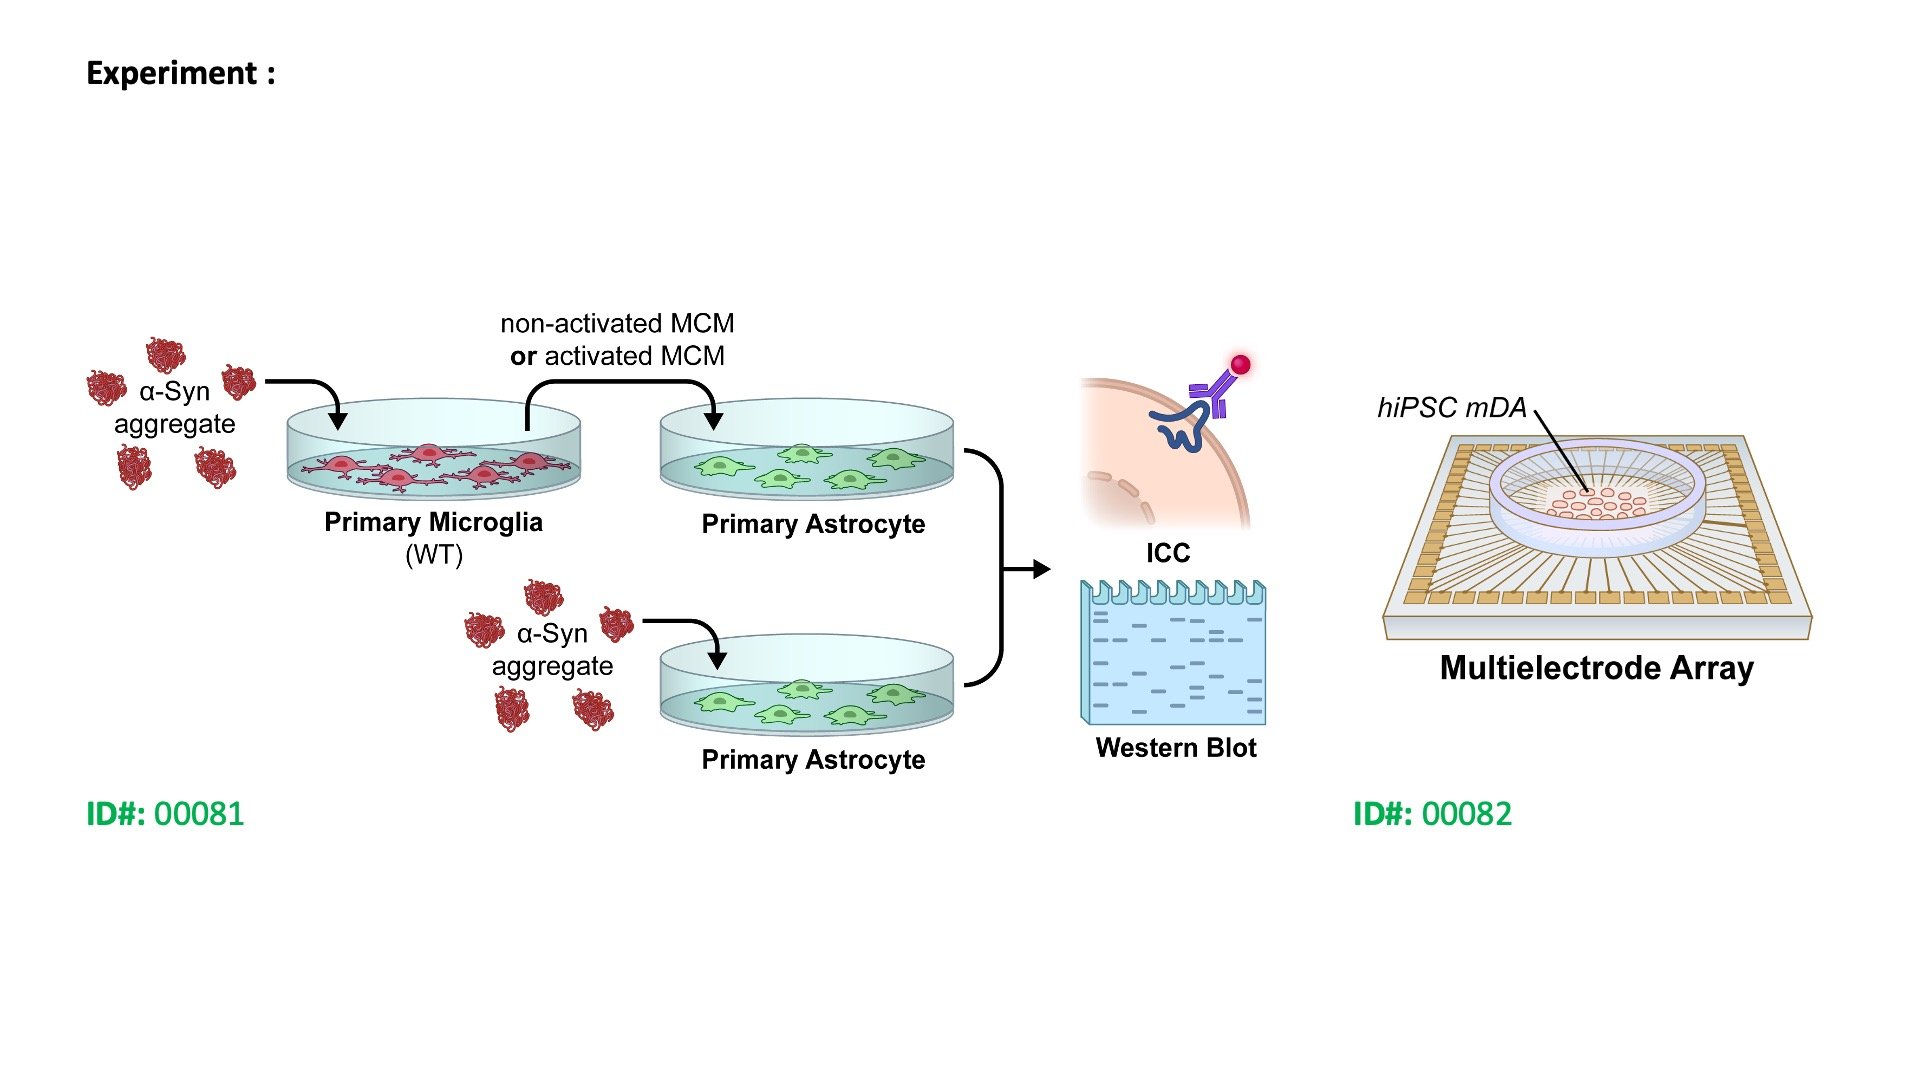
STOCK IMAGE CATALOGUE

An illustration of a brown mouse with pink ears, pink paws, and a pink tail, viewed from a color-oblique angle.
Four illustrations of a mouse in lateral view, each with a different shading pattern or outline style.
Illustration of three fruit flies, showing top, side, and top-down views with data labels for males and females.
A collection of diagrams showing different mouse behavior tests, including water maze, Y-maze, pole, open field, and grip strength tests, with some tests featuring a mouse navigating through various mazes or gripping a wire.
Illustrations of two laboratory tests involving rats. The left shows a pole test with a rat hanging from a vertical pole, and the right shows a grip strength test with a rat holding a horizontal bar while a gloved hand pulls on its tail.
Diagram showing three mouse brains at different angles, each with labeled IDs and titles, and arrows pointing to cross-sectional views of their brains.
Three diagram slices of a mouse brain, labeled with IDs 00019, 00020, and 00021, showing different cross-sections in a coronal view with a pink and beige color scheme.
Diagram of four types of brain cells: top left, ramified microglia with many branching extensions; top right, reactive microglia with fewer and thicker extensions; bottom left, nonreactive astrocyte with star-shaped structure and thin extensions; bottom right, reactive astrocyte with a more expanded structure and thicker extensions. Each cell type is labeled with ID and title.
Illustration of three cell types: a generic cell, a generic cell with mitochondria, and a neuron with myelin, each labeled with ID numbers and titles.
Diagram of mouse anatomy with labeled illustrations of the mouse stomach and two views of the mouse brain, one superior and one lateral.
Diagram of a gut-brain Parkinson's disease model and laser capture microscopy process. The gut-brain model shows a mouse with an injection of alpha-synuclein preformed fibrils into the gut, which interacts with the vagus nerve. The microscopy setup depicts a laser capturing a tissue sample from nervous tissue using laser capture microscopy.
Diagram depicting an experiment involving mice with injections, microglia culture, and molecular analysis with Western blot and PCR methods.
Diagram of two experimental procedures involving microglia and astrocytes. The left side shows pretreatment of primary microglia with CMPD067, followed by lysate and Western blot analysis. The right side shows pretreatment of primary microglia with CMPD067, induction of primary astrocytes with MCM, and subsequent analysis with qPCR, Western blot, and immunocytochemistry.
Diagram showing a scientific experiment workflow involving protein modification, cell transfection, and immune cell activation. The process includes protein cleavage, purification, and cell culture steps leading to immunological assays.
Diagram showing experimental procedures involving primary microglia, astrocyte, and cortical neurons, with details on treatments using alpha-synuclein pre-formed fibrils (PFF) and aggregates, and analyses like Western blot, tissue lysate, TUBE pull-down, and detection of NF-kB and MAPK signaling.
Illustration of a human brain, viewed from the side, with one depiction inside a gray silhouette of a male head and another as a standalone, detailed brain diagram.
Diagram illustrating the process of alpha-synuclein amyloid aggregation, showing monomers, unfolded monomers, oligomers, protofibril oligomers, and fibril aggregates with labels and color-coded visuals.
Diagram comparing two laboratory methods: Indirect ELISA on the left and Proximity Ligation Assay (PLA) on the right. The ELISA diagram shows a plate well with a human Fc-specific antibody attached to a red alpha-synuclein aggregate, and various labels indicating components like peroxidase, Fc tag, NOD2, and different mutant variants. The PLA diagram includes a tangled blue PLA probe with red detection oligos, green secondary antibody, blue primary antibody, and labels for NOD2 and alpha-synuclein aggregate.
Flowchart of an experiment involving primary microglia and astrocytes, primary cortical neurons with and without treatment, leading to assessments by Western blot, immunofluorescence, and neural cell death assay, and culminating in analysis with multielectrode array.
Diagram illustrating a protein detection experiment using HEK293T cells and Western blot analysis. It shows cell transfection, sonication to obtain lysates, protein binding to agarose beads, and detection of proteins with a protease and specific antibodies, including a schematic of protein complexes and labels for experimental steps.
Diagram of an experiment involving transfection of HEK293T cells with a viral vector, followed by microglial cell culture and immune response analysis in mice. The process includes fluorescent imaging and NF-kB luciferase assay.
Diagram showing three types of DNA structures: a DNA double helix, a double-strand break in DNA, and mitochondria. The diagram is titled 'Nucleic Acids and Organelles' and includes labels with IDs and titles for each structure.
Illustration of a microscope, five test tubes with different colored liquids labeled 'Isolation,' 'Processing,' and others, and four petri dishes with various colored cell cultures, all with labels and IDs.
Diagram showing the surface plasmon resonance (SPR) setup. It includes a light source, a detection unit, and a sensor chip labeled CARBOXy SENSOR CHIP. The diagram illustrates the injection of FLNOD2 into a flow, interacting with α-Syn aggregates/PMCA from normal or Parkinson's disease patients, and the resulting binding to NOD2 proteins on the chip.
Diagram showing experimental procedures involving brain tissue analysis in a mouse model of Parkinson's disease, including tissue collection, immunohistochemistry, Western blotting, and PCR, with timeline details for injections and analysis.
Flowchart of an experiment testing the effects of alpha-synuclein aggregates on microglia and behavior in mice, with timeline, methods, and RNA sequencing validation.
Flowchart of an experimental protocol involving primary microglia transduction and analysis. The left side shows microglia extraction, cell homogenization, and separation into cytosolic and nuclear fractions, followed by western blotting. The right side depicts transduction with lentiviral vector, treatment with alpha-synuclein PFF or monomer, primary microglia preparation, and western blot analysis. ID numbers 00074 and 00075 are noted.
Diagram showing an experiment with primary microglia and astrocytes, illustrating alpha-synuclein congregation, cell activation states, and detection methods including Western blot and multi-electrode array with high-density human iPSC-derived microglia.